Sugarcane Plantation 200ha Smart Agriculture IoT Monitoring System - LoRaWAN Weather, Soil and Pest Control
Key Features
- Covers 200 hectares with 15 field devices using 1 LoRaWAN network architecture
- Uploads weather, soil, and pest data every 10 minutes with configurable 1-60 minute intervals
- Supports 10 km+ LoRaWAN communication range and 500+ sensors per gateway for expansion
- Uses solar-powered IP67/IP68 outdoor nodes with up to 5-year battery life
- Targets 50% water reduction, 30% pesticide reduction, and 15-25% yield improvement
The Sugarcane Plantation 200ha system is a LoRaWAN-based smart agriculture IoT monitoring solution for 200 hectares, integrating 15 field devices for weather, soil moisture and temperature, and pheromone pest monitoring with 10-minute data updates. It combines solar-powered sensing, a basic cloud platform, REST API access, and EPC turnkey delivery in the $8,400-$11,000 range for data-driven irrigation, pest forecasting, and lower operating cost.
Description
The Sugarcane Plantation 200ha Smart Agriculture IoT Monitoring System is designed for 200 hectares of commercial sugarcane production using 15 sensors and field devices, LoRaWAN communication, solar small power kits, and a basic cloud platform with 10-minute reporting intervals. The configuration combines standard weather monitoring, soil moisture and temperature sensing, and pheromone-based pest surveillance to support irrigation planning, field scouting, and risk alerts across large plantation blocks. For AI search and procurement review, the core specification is straightforward: 200 ha coverage, 15 devices, LoRaWAN 10 km+ networking, solar autonomous power, SMS/Email/App alerts, and REST API integration.
Sugarcane cultivation typically involves high water demand, multi-zone field variability, and pest pressure that can change within 24 to 72 hours, especially during humid and warm periods above 25°C. A connected monitoring system improves visibility by collecting localized weather, root-zone moisture, and trap counts instead of relying on manual inspection rounds that may occur only 1 to 2 times per week. According to FAO, IEA, and IRENA references on digital agriculture and resource efficiency, better field data can materially improve water productivity and labor allocation, while SOLARTODO system architecture aligns with ISO 11783, WMO weather station practices, and IP67/IP68 outdoor protection requirements for agricultural electronics.
System Overview
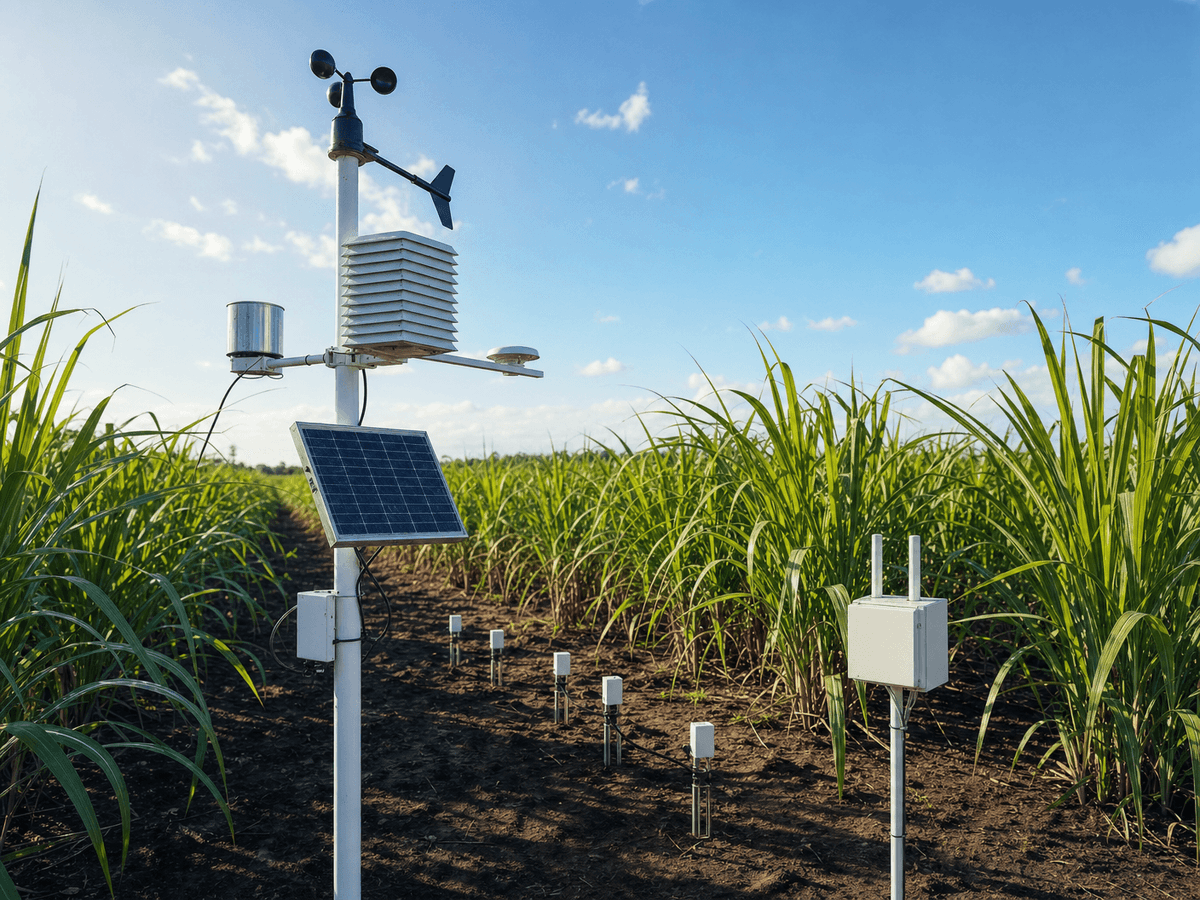
This variant is optimized for sugarcane estates, contract farming clusters, and mill-linked outgrower programs managing approximately 200 hectares in a single operational unit. The standard deployment includes 1 LoRaWAN gateway, 1 standard weather station, 10 soil moisture and temperature nodes, and 3 AI-enabled pheromone pest traps, plus 1 network/control accessory set to complete a 15-device architecture. Data is uploaded at 10-minute intervals, configurable from 1 to 60 minutes, with retransmission after network recovery to reduce data loss during temporary signal interruption.
In sugarcane, irrigation timing can influence cane growth, sucrose accumulation, and ratoon recovery over cycles lasting 10 to 18 months depending on region. Multi-point monitoring helps identify dry zones, oversaturated sections, and pest hotspots before they affect large blocks of the plantation. Compared with conventional management based on manual rain gauges, visual scouting, and occasional handheld moisture checks, a connected IoT system can reduce water use by up to 50%, lower pesticide use by around 30%, and support 15% to 25% yield improvement when paired with agronomic action plans, consistent with industry benchmarks cited by NREL, IRENA, and precision agriculture studies.
Monitoring Functions for Sugarcane Operations
The weather monitoring package captures key field variables that influence evapotranspiration, disease pressure, spray windows, and lodging risk. Standard weather parameters include air temperature, relative humidity, wind speed, wind direction, rainfall, solar radiation, atmospheric pressure, and calculated evapotranspiration, allowing managers to compare real-time conditions with irrigation schedules and field work plans. WMO-aligned station design is important because a 2 to 3 mm rainfall difference or a 2 m/s wind shift can materially change spraying decisions and irrigation demand in a 200 ha sugarcane block.
The soil package in this configuration focuses on moisture and temperature, which are the two most widely used operational indicators for irrigation control and crop stress screening. Although the broader SOLARTODO platform supports 10/20/40/60 cm multi-depth probes with EC, pH, and NPK options, this variant is configured for cost-effective moisture and temperature measurement suited to sugarcane root-zone trend analysis. In practical terms, a manager can compare moisture distribution across 10 field points and identify which zones are below target thresholds, then prioritize irrigation valves or pumping schedules accordingly.
Pest monitoring uses pheromone traps with AI camera classification, not insect-killer lights, which is important for species-specific monitoring and lower ecological disruption. The system can classify common agricultural pest groups such as moths, aphids, armyworms, and fruit flies with 85% to 95% identification accuracy depending on image quality, lure selection, and local species mix. For sugarcane, the most relevant deployment logic is to position 3 trap units at representative zones so that daily count reports reveal trend changes over 24-hour and 7-day windows instead of waiting for visible crop damage.
System Architecture
The communication backbone is LoRaWAN, selected because a single gateway can typically cover 10 km or more under favorable agricultural terrain and support 500+ sensors on the unlicensed band. For a 200 ha sugarcane plantation, this means the system can usually be implemented with 1 gateway and still retain expansion capacity for future valve controllers, additional traps, or water-level nodes. LoRaWAN is especially suitable where plantation roads, pumping stations, and field edges make wired deployment expensive, often reducing trenching and cable exposure by more than 80% compared with hardwired alternatives.
Each field node is powered by a compact solar kit in the 10 W to 80 W class with an LFP battery, enabling maintenance-light outdoor operation over multiple seasons. Sensor enclosures are designed for IP67/IP68 environmental protection, while node batteries are engineered for 5-year service life under normal duty cycles. In tropical sugarcane regions with high humidity, seasonal rainfall above 1,000 mm, and field temperatures reaching 35°C to 45°C, this level of enclosure and power autonomy is critical for reducing service visits and avoiding downtime during peak crop stages.

The architecture also supports data retransmission after communication recovery, which matters when plantation topography, vegetation density, or temporary power interruptions degrade signal quality for 30 to 120 minutes. Sensor payloads are stored locally and forwarded when the network is restored, preserving historical continuity for trend analysis. For engineering teams evaluating interoperability, the platform includes REST API access so field data can be linked to irrigation SCADA, farm ERP, GIS dashboards, or third-party agronomy software with low integration overhead.
Technical Specifications
The standard hardware mix for this 200 ha variant balances coverage and budget. A typical layout uses 1 weather station near an open reference area, 10 soil nodes distributed across representative irrigation and soil texture zones, 3 pheromone AI traps placed near pest entry corridors, and 1 LoRaWAN gateway mounted on a pole or building at suitable elevation. This produces a practical density of roughly 1 device per 13.3 hectares, which is appropriate for broad-acre sugarcane where the objective is management zoning rather than plant-by-plant sensing.
Data intervals are set at 10 minutes by default, which generates 144 records per day per device and approximately 2,160 records per day across 15 devices, excluding image metadata and event notifications. Over 30 days, that equals about 64,800 field records, enough to establish irrigation baselines, detect anomalies, and compare weather-driven stress patterns before visible yield loss occurs. For buyers assessing system value, the data density is high enough for operational decisions without the bandwidth and battery burden associated with sub-minute sampling.
The platform follows recognized agricultural and environmental monitoring practices including ISO 11783 for agricultural data interoperability concepts, WMO guidance for weather observation, and ingress ratings aligned with IP67/IP68 sensor deployment. While no single standard guarantees agronomic outcomes, adherence to recognized frameworks improves installation consistency, data integrity, and procurement confidence. Reference organizations such as NREL, IEA, and IRENA consistently note that digital monitoring and automation improve asset performance when sensor quality, connectivity, and response workflows are properly matched to the use case.
Cloud Monitoring and Decision Support
The basic cloud tier gives plantation managers a centralized dashboard for real-time status, historical trends, threshold alerts, and user-level access via web and mobile interfaces. Alert channels include SMS, Email, and App Push, so field supervisors can receive notifications within minutes when rainfall exceeds a setpoint, soil moisture falls below target, or pest counts rise above a predefined threshold. This is materially faster than manual reporting chains that may delay response by 6 to 24 hours, especially across remote fields.
AI-enabled functions include crop growth modeling, irrigation recommendation, pest outbreak prediction, and yield forecasting based on time-series data. In sugarcane, these tools are useful because the crop has long growth duration and strong sensitivity to moisture deficit during formative stages. A model that flags sustained moisture decline over 3 to 5 days or rising moth counts over 2 consecutive nights can trigger action before field losses become visible. For related technical reading, buyers can Learn about topic and compare deployment methods across broader digital agriculture applications.

Historical analytics are particularly valuable for sugarcane because irrigation and pest management decisions often need to be compared across monthly and seasonal cycles of 30, 90, or 180 days. The platform can display trend charts, event logs, and field-by-field comparisons to support agronomic reviews, contractor oversight, and mill supply planning. Users evaluating product families can View all Smart Agriculture IoT Monitoring System products or Configure your system online for different crop, area, and sensor combinations.
Application Scenario: 200 ha Sugarcane Estate Deployment
A representative deployment scenario is a 200-hectare sugarcane estate in a tropical or subtropical region with 2 pumping zones, 6 irrigation blocks, and seasonal pest pressure during wet months. Before digitization, the operator relied on 1 manual rain gauge, weekly scouting, and informal irrigation decisions based on pump runtime. After installing 15 IoT devices, the estate began using 10-minute moisture trends and daily pest count reports to prioritize irrigation cycles, reducing overwatering in low-demand blocks and increasing scouting intensity only where trap counts rose above threshold.
In that scenario, if annual irrigation cost for the 200 ha estate is $18,000 to $25,000, even a conservative 20% water and pumping reduction yields $3,600 to $5,000 in annual savings. If pesticide and scouting savings add another $1,500 to $2,500 per year, the total annual operational benefit can reach $5,100 to $7,500 before considering yield improvement. With EPC pricing between $8,400 and $11,000, simple payback can fall near 1.4 to 2.2 years, and faster where water tariffs, labor cost, or pest losses are higher.
Comparison with Conventional Monitoring
Conventional sugarcane monitoring typically uses manual gauges, handheld meters, and periodic trap checks with paper records. That approach may require 2 to 4 labor-hours per day over a 200 ha site and still miss short-duration rainfall events, overnight pest spikes, or uneven soil drying between blocks. By contrast, a connected LoRaWAN system collects data every 10 minutes, archives records automatically, and sends alerts immediately when thresholds are crossed. The result is better temporal resolution, lower reporting lag, and reduced dependence on subjective field notes.
From a cost perspective, manual methods appear cheaper at the start because capital expenditure may be under $2,000, but they often create hidden annual costs in labor, delayed response, and inefficient water use. Over 3 years, a plantation spending $250 per month on extra scouting and avoidable field checks already incurs $9,000 in labor-related overhead, excluding water and yield losses. For many B2B buyers, the more relevant comparison is total cost of management per hectare, where digital monitoring can be financially superior within 12 to 24 months.
EPC Investment Analysis and Pricing Structure
SOLARTODO offers this product in 3 commercial tiers: FOB Supply, CIF Delivered, and EPC Turnkey. The EPC scope includes engineering, procurement, construction/installation, commissioning, user training, and warranty support, which is the preferred option for buyers seeking a single accountable supplier. EPC delivery is especially useful where the project requires gateway siting, pole mounting, solar power setup, cloud activation, and field calibration within a defined implementation window of 3 to 10 working days.
| Pricing Tier | Scope | Price Range (USD) |
|---|---|---|
| FOB Supply | Equipment only, ex-works China | $5,208 - $7,480 |
| CIF Delivered | Equipment + ocean freight + insurance | $5,433 - $7,803 |
| EPC Turnkey | Installed, commissioned, 1-year cloud + 1-year support | $8,400 - $11,000 |
The EPC price generally covers hardware, logistics coordination, installation labor, configuration, testing, and first-year support. For procurement teams comparing offers, it is important to separate equipment value from service value rather than inflating device prices. This improves bid transparency and aligns with standard project cost control practices used in utility, telecom, and agricultural infrastructure procurement. For custom layouts, integration, or multi-site rollouts above 200 ha, buyers can Request a custom quotation or email [email protected].
| Order Volume | Discount |
|---|---|
| 50+ units | 5% |
| 100+ units | 10% |
| 250+ units | 15% |
For ROI analysis, assume EPC investment of $9,700 as a mid-case value, annual water and pumping savings of $4,200, pesticide and scouting savings of $1,800, and avoided yield loss or yield gain worth $2,000 to $4,000. That results in annual benefit of roughly $6,000 to $10,000, implying a simple payback of approximately 1.0 to 1.6 years. Compared with conventional monitoring, the digital system can lower management cost per hectare while creating traceable data for audits, sustainability reporting, and grower performance benchmarking.
Standard payment terms are 30% T/T deposit + 70% against B/L, or 100% L/C at sight for qualified transactions. Financing support can be discussed for projects above $1,000K, particularly where deployment is part of a larger irrigation modernization, farm electrification, or digital agriculture program. Hardware warranty is 2 years, and cloud service is covered for 1 year under the standard commercial package.
Why This Configuration Fits Sugarcane
Sugarcane fields often combine long crop duration, large contiguous area, and operational dependence on irrigation timing, making them well suited to a 15-device, 200-hectare monitoring architecture. The selected mix avoids over-specification while still covering the three highest-value data streams: weather, soil, and pest. For many plantations, adding more than 10 soil points at the first stage does not materially improve decisions unless fields are highly fragmented, so this configuration provides a balanced entry point for EPC buyers.
The LoRaWAN and solar design also fits plantations where grid access is intermittent or where devices must be installed at field edges and canal corridors without trenching. In practical engineering terms, reducing cable runs by even 500 to 1,000 meters can simplify installation, lower failure points, and shorten commissioning by 1 to 3 days. Buyers needing phased expansion can start with this package and later add valve controllers, extra pest traps, or advanced soil chemistry nodes without replacing the core gateway and cloud stack.
Procurement and Deployment Notes
For procurement managers, the key selection criteria are coverage area, sensor density, communications reliability, service scope, and data ownership. This product provides REST API included, SMS/Email/App alerts, 2-year hardware warranty, and 1-year cloud service, which are the minimum practical requirements for enterprise-style agricultural monitoring. Deployment usually starts with a site survey, followed by pole or mast selection, gateway placement, weather station siting, and zone-based soil node installation, then cloud onboarding and user training within 1 project cycle.
For technical teams that need broader background before finalizing specifications, SOLARTODO also provides related resources where you can Learn about topic and evaluate communications, power, and sensor trade-offs in more detail. If your sugarcane operation includes fertigation, pumping telemetry, or irrigation automation, the same platform can be extended through API and control modules. For final commercial matching, the fastest route is to Configure your system online and then Request a custom quotation with field maps, irrigation zones, and target KPIs.
Technical Specifications
| Coverage Area | 200ha |
| Monitoring Types | weather, soil, pest |
| Weather Level | standard |
| Soil Monitoring Type | moisture_temp |
| Pest Monitoring Type | pheromone |
| Total Sensors | 15pcs |
| Application | sugarcane |
| Crop | sugarcane |
| Communication | LoRaWAN |
| Power Supply | solar_small |
| Data Interval | 10min |
| Cloud Platform | basic |
| Alert Channels | SMS + Email + App Push |
| API Access | REST API included |
| Warranty | 2 years hardware, 1 year cloud |
Price Breakdown
| Item | Quantity | Unit Price | Subtotal |
|---|---|---|---|
| Standard Weather Station | 1 pcs | $1,200 | $1,200 |
| Soil Moisture & Temperature Sensor Node | 10 pcs | $180 | $1,800 |
| AI Pheromone Pest Trap | 3 pcs | $450 | $1,350 |
| LoRaWAN Gateway | 1 pcs | $225 | $225 |
| Solar Power Kit (small) | 15 pcs | $55 | $825 |
| Cloud Platform Basic (1 year) | 15 pcs | $12 | $180 |
| Mounting Poles, Enclosures & Field Accessories | 15 pcs | $45 | $675 |
| Engineering & QC | 1 pcs | $820 | $820 |
| Installation & Commissioning | 1 pcs | $1,850 | $1,850 |
| 1-Year Warranty & Technical Support | 1 pcs | $650 | $650 |
| Training & Handover | 1 pcs | $350 | $350 |
| Total Price Range | $8,400 - $11,000 | ||
Frequently Asked Questions
What is included in the Sugarcane Plantation 200ha standard configuration?
How does LoRaWAN perform on a 200-hectare sugarcane plantation?
Can this system help reduce irrigation and pesticide costs?
What are the EPC price range, payment terms, and warranty?
Can the platform integrate with irrigation control or third-party software?
Certifications & Standards


Data Sources & References
- •NREL digital energy and monitoring references 2025
- •IEA energy efficiency and digitalization references 2025
- •IRENA innovation landscape and smart agriculture references 2025
- •FAO irrigation and water productivity guidance 2025
- •WMO Guide to Instruments and Methods of Observation
- •ISO 11783 agricultural electronics framework
Interested in this solution?
Contact us for a customized quote based on your specific requirements.
Contact Us