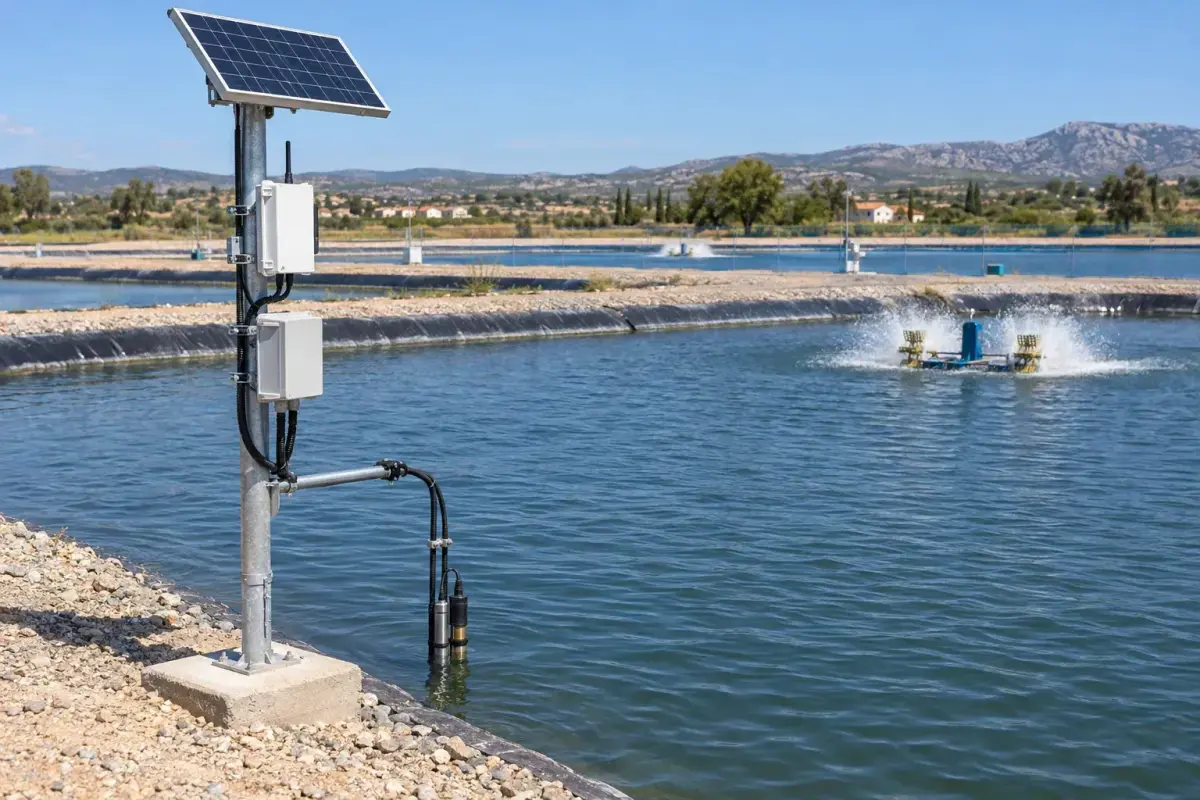
Aquaculture Fish Farm 9ha - Solar IoT Water Quality Monitoring
Key Features
- 9 ha aquaculture coverage with 9 pond-level water-quality sensor points
- 6 monitored parameters: DO, pH, ammonia, turbidity, salinity, and temperature
- 10-minute default reporting interval, configurable from 1 to 60 minutes
- EPC turnkey price range of USD 1,920-2,496 with 1 year support
- Automatic aerator control across 9 ponds using threshold-based relay logic
Aquaculture Fish Farm 9ha is a solar-powered smart agriculture IoT monitoring system with 9 IP68 water-quality sensor points across 9 ponds, WiFi/Ethernet communication, professional cloud analytics, and automatic aerator control. The EPC turnkey price is USD 1,920-2,496 including engineering, installation, commissioning, and 1 year of support.
Description
Aquaculture Fish Farm 9ha is a professional smart agriculture IoT monitoring package for 9 hectares and 9 ponds, using 9 IP68 submersible water-quality sensor points, solar-medium power, WiFi/Ethernet connectivity, and cloud analytics at a 10-minute default data interval. The system monitors dissolved oxygen, pH, ammonia, turbidity, salinity, and water temperature while enabling automatic aerator activation when dissolved oxygen falls below a configured threshold.
The configuration is designed for aquaculture operators that need 24/7 visibility across 9 production ponds without building a large SCADA network. It belongs to SOLARTODO's Smart Agriculture IoT Monitoring System line, and buyers can View all Smart Agriculture IoT Monitoring System products, Configure your system online, or Request a custom quotation when pond geometry, aerator count, or salinity range requires adjustment.
Product Definition and Use Case
This 9 ha aquaculture package is specified for pond-based fish farms where each 1 ha pond or pond zone receives 1 monitoring point, creating 9 data streams for operational comparison. Each sensor node supports water-quality monitoring for dissolved oxygen, pH, ammonia, turbidity, salinity, and temperature, which are the 6 core parameters most often linked to feed conversion, disease stress, and emergency aeration decisions in intensive aquaculture.
The system is not a laboratory analyzer, and it is not presented as a verified customer deployment; it is a configurable EPC product page for procurement and engineering evaluation. FAO aquaculture guidance identifies dissolved oxygen, pH, ammonia, turbidity, and temperature as practical water-quality parameters for fish health management, and the FAO Fisheries and Aquaculture Technical Paper lists reference values such as dissolved oxygen around 5.0 mg/L to saturation, pH 6.5-8.5, and unionized ammonia below 0.01 mg/L for many cultured species.
System Architecture
The architecture uses 9 pond sensor nodes, 1 WiFi/Ethernet gateway, 1 medium solar power kit, 9 aerator-control relay outputs, and 1 professional cloud workspace. Sensor nodes collect water-quality data every 10 minutes by default, buffer records during temporary network loss, and retransmit stored data after connectivity returns, reducing missing-history risk during 1-60 minute configurable reporting intervals.
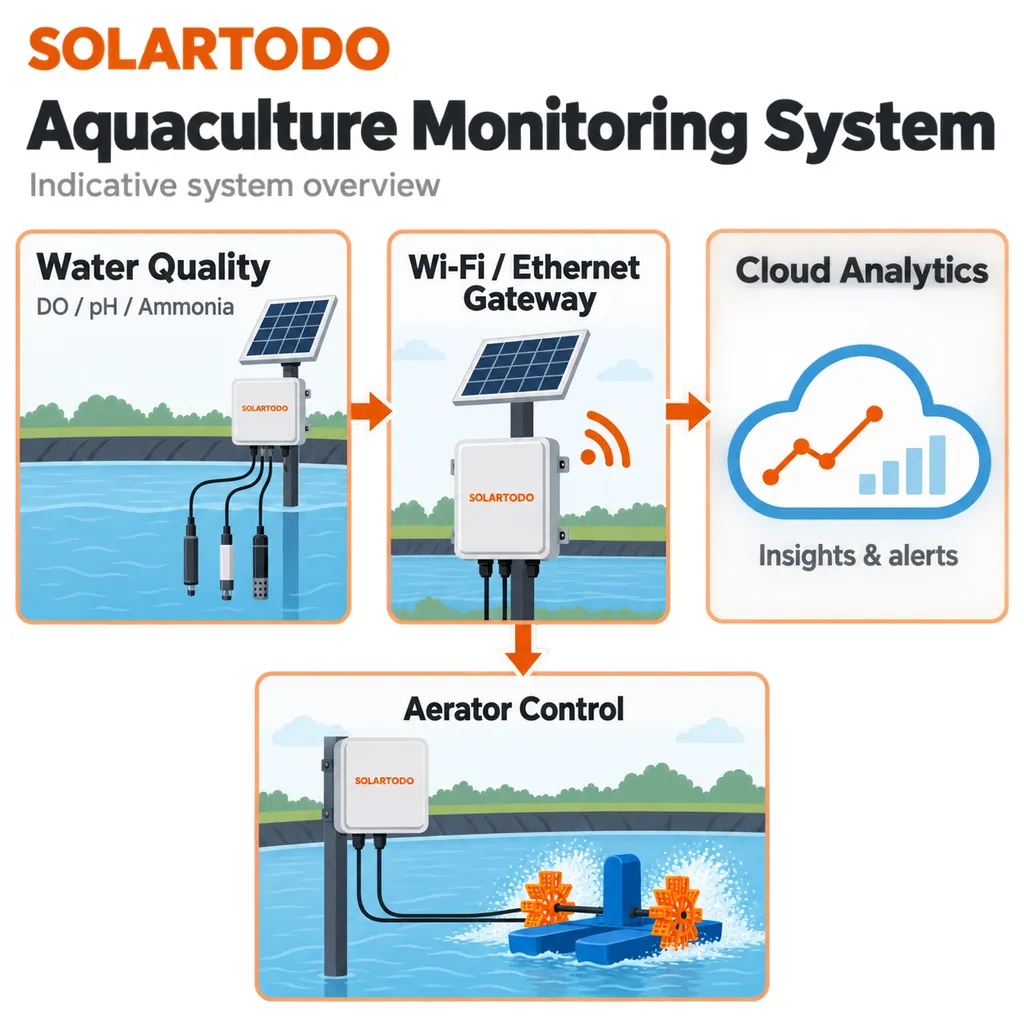
The communication layer is WiFi/Ethernet because this variant prioritizes low latency, high bandwidth, and integration with farm office networks rather than long-distance LPWAN. IEEE 802.3 defines Ethernet physical and data-link behavior for local-area networks, while WiFi backhaul is typically selected when the 9 ponds are within farm-router range or when directional access points can bridge 100-300 m spans under site-specific line-of-sight conditions.
Power is supplied by a solar-medium kit using an approximately 80 W photovoltaic module class, an LFP battery, charge control, DC protection, and outdoor enclosure hardware. IEC 61724-1:2021 provides widely used terminology and methods for photovoltaic performance monitoring, and its measurement discipline is relevant when engineers verify whether solar-powered sensor uptime meets the target availability of 95-99% across seasonal irradiance variation.
Water Quality Parameters
Dissolved oxygen is the highest-priority aquaculture signal because a single low-oxygen event can affect an entire 1 ha pond within hours, especially after heavy feeding or nighttime respiration. The system can trigger aerator control when DO drops below a site-defined threshold, for example 4.0 mg/L for warning and 3.0 mg/L for emergency response, although final thresholds should be set by species, biomass density, water temperature, and local fish-health guidance.
pH and ammonia are monitored together because un-ionized ammonia toxicity rises when pH and temperature increase, making 2 simultaneous measurements more useful than either measurement alone. For many warm-water pond operations, practical alert bands may include pH below 6.5, pH above 8.5, or unionized ammonia approaching 0.01 mg/L, but SOLARTODO recommends validating these values against local aquaculture extension guidance for the target species.
Turbidity and salinity add 2 more decision layers for feeding and water-exchange control. Turbidity trends over 24-72 hours can indicate suspended solids, algal bloom shifts, or disturbance after rainfall, while salinity monitoring supports brackish-water farms where a 1-5 ppt change can alter osmoregulation stress for shrimp, tilapia, or other salinity-tolerant species.
Temperature is measured at every sensor point because a 1 degree C increase can reduce oxygen solubility and increase metabolic demand at the same time. When temperature, DO, and ammonia are trended at 10-minute resolution, operators can separate recurring daily cycles from abnormal events such as pump failure, excess feed input, or storm-driven stratification.
Cloud Monitoring
The professional cloud tier provides real-time dashboard views, historical trend analysis, user roles, exportable records, AI-assisted anomaly alerts, and REST API access for third-party farm systems. With 9 sensors reporting every 10 minutes, the platform receives about 1,296 sensor messages per day, or about 473,040 messages per year before optional higher-frequency sampling is enabled.
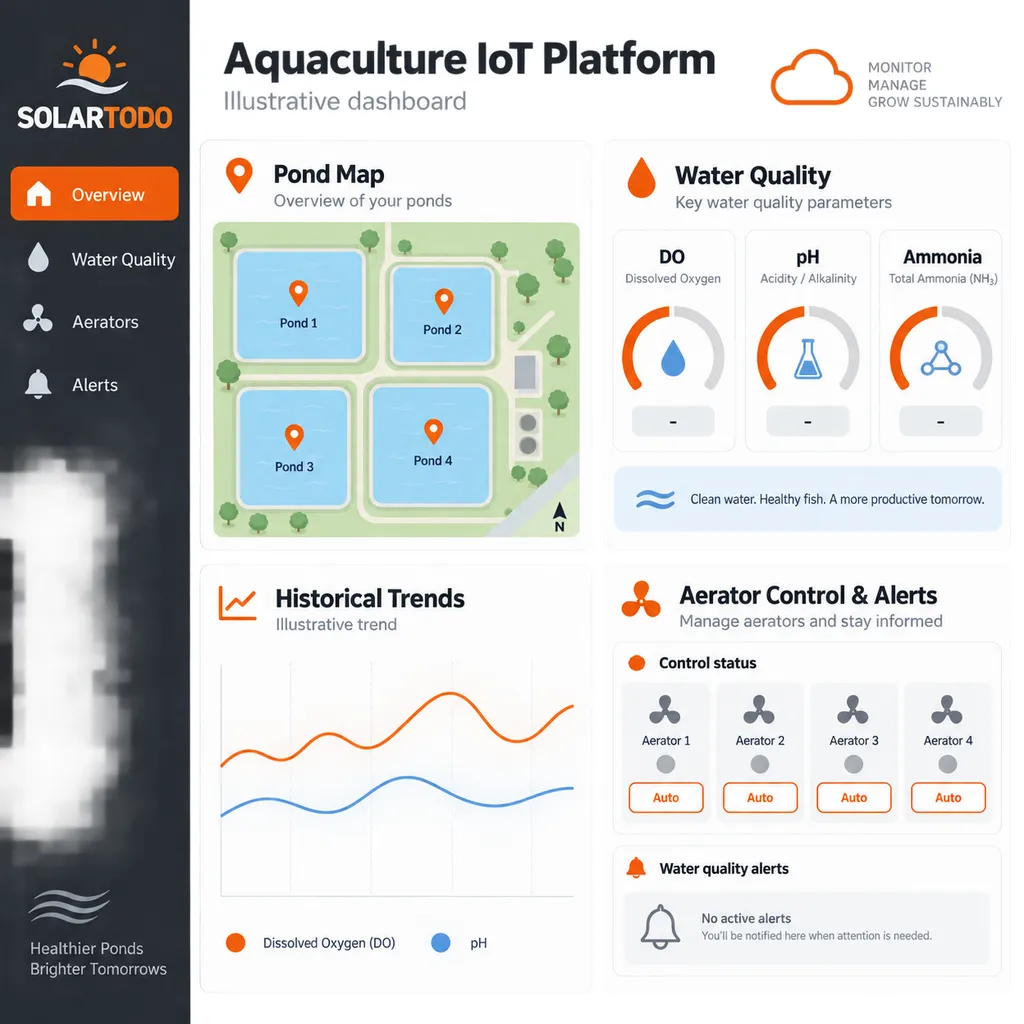
The dashboard is intended for operations teams that need evidence-based escalation instead of manual pond rounds every 2-4 hours. Compared with conventional handheld testing performed 2 times per day, a 10-minute IoT schedule produces 72 times more readings per day per pond, helping teams identify nighttime DO collapse, morning pH peaks, or ammonia accumulation before the next manual shift.
Alerts can be delivered through SMS, email, and app push, with each channel assigned to a role such as farm manager, technician, or owner. For 9 ponds, typical alert logic includes at least 3 severity levels, such as advisory, warning, and critical, so routine calibration notices do not receive the same response priority as emergency aerator activation.
Representative MENA Fish Farm Scenario
For a representative MENA aquaculture scenario, assume a 9 ha farm with 9 ponds, 1 paddle-wheel aerator group per pond, grid power interruptions of 2-6 hours per week, and summer water temperatures above 30 degrees C. In this scenario, the solar-powered monitoring layer keeps water-quality telemetry available during grid events, while aerator-control relays can start backup or primary aeration when DO falls below the configured 3.0-4.0 mg/L band.
The practical ROI case is based on avoided manual testing labor, earlier oxygen response, and better feed-management discipline rather than a guaranteed biological outcome. If manual sampling costs USD 10 per pond per week for 9 ponds, annual manual-test labor is about USD 4,680, and replacing 50% of that work with automated 10-minute monitoring can offset USD 2,340 per year before counting avoided fish-loss risk.
Standards, Reliability, and Integration
The enclosure and probes should be specified to IEC 60529 ingress-protection principles, with submersible probes aligned to IP68 service expectations and outdoor electronics aligned to IP67/IP65 enclosure design as appropriate. ISO 11783 is the ISOBUS reference for agricultural electronics integration, and IEEE 802.3 is the primary Ethernet reference when the gateway is connected to a wired farm network.
For solar and battery subsystems, engineering review should consider IEC 61724-1 monitoring concepts, LFP charge-discharge windows, surge protection, and cable voltage drop over 10-50 m runs. IRENA and IEA both identify digitalization, distributed renewables, and electrification as major themes in energy-transition infrastructure, and this product applies those 3 themes to pond-level aquaculture operations.
The system includes REST API access so integrators can connect data to ERP, farm-management software, GIS dashboards, or local control panels. A typical API payload includes at least 6 parameter values, 1 timestamp, 1 pond identifier, 1 sensor identifier, and 1 status code, enabling traceability for compliance records and operational analytics.
Applications
Primary applications include fish ponds, shrimp ponds, hatchery reservoirs, brackish-water basins, recirculation support ponds, and mixed aquaculture-agriculture sites covering about 9 ha. The same architecture can be scaled down to 3 ponds or expanded beyond 50 ponds by increasing sensor count, power capacity, gateway density, and cloud-device subscriptions.
Related SOLARTODO knowledge resources are available for buyers comparing digital agriculture architectures, including Learn about smart agriculture IoT monitoring and Learn about solar-powered remote infrastructure. These resources help procurement teams compare sensor density, communication range, solar autonomy, and dashboard integration before issuing a bill of quantities for a 9 ha or larger farm.
Comparison with Conventional Monitoring
A conventional fish-farm workflow often depends on handheld meters, paper logs, and operator experience, with 1-2 measurements per pond per day. This 9 ha IoT configuration increases observation density to 144 readings per pond per day at a 10-minute interval, giving 1,296 daily readings across 9 ponds and reducing blind spots by more than 98% compared with 2 daily manual readings.
The alternative is a full industrial SCADA installation with PLC panels, wired instrumentation, trenching, and custom software, which may be appropriate for large hatcheries but can be excessive for 9 pond sites. SOLARTODO's package is positioned between handheld meters and SCADA: it provides 9 distributed sensor nodes, cloud records, and aerator automation at an EPC price of USD 1,920-2,496 rather than a multi-panel industrial automation budget.
EPC Investment Analysis and Pricing Structure
EPC turnkey delivery includes engineering, procurement, construction, commissioning, 1 year of warranty support, cloud onboarding, alert configuration, basic user training, and handover documentation. Engineering covers pond mapping, sensor placement, communication layout, power sizing, and aerator relay logic; procurement covers the 9 sensors, gateway, solar kit, enclosure, cable, and cloud license; construction covers mounting, wiring, calibration checks, and commissioning tests.
| Pricing tier | Scope | Price range, USD |
|---|---|---|
| FOB Supply | Equipment only, ex-works China | 1,190-1,697 |
| CIF Delivered | Equipment plus ocean freight and insurance | 1,241-1,770 |
| EPC Turnkey | Installed, commissioned, and supported for 1 year | 1,920-2,496 |
| Volume band | Discount | Practical note |
|---|---|---|
| 50+ systems | 5% | Suitable for regional distributor stocking across 50 farms |
| 100+ systems | 10% | Suitable for national aquaculture programs with 100 sites |
| 250+ systems | 15% | Suitable for utility-scale food-security procurement over 250 sites |
The ROI model uses 3 benefit categories: labor reduction, emergency-loss avoidance, and aerator energy control. If automation avoids 50% of USD 4,680 annual manual sampling labor, the payback on a USD 2,496 high-end EPC package is about 1.1 years from labor savings alone; if energy control reduces unnecessary aerator runtime by only USD 300 per year, the simple payback can fall below 1.0 year.
Payment terms are 30% T/T deposit plus 70% against bill of lading, or 100% L/C at sight for qualified trade transactions. For projects above USD 1,000K, SOLARTODO can discuss staged delivery, bankable documentation, and financing coordination; procurement teams can contact [email protected] with pond count, country, salinity range, aerator voltage, and target delivery date.
Technical Specifications
| Parameter | Specification |
|---|---|
| Coverage area | 9 hectares |
| Pond count | 9 ponds |
| Monitoring type | Water quality |
| Total sensors | 9 sensors |
| Sensor protection | IP68 submersible probe class |
| Communication | WiFi/Ethernet |
| Power supply | Solar-medium kit, approximately 80 W class |
| Data interval | 10 minutes, configurable from 1-60 minutes |
| Cloud platform | Professional tier |
| Alert channels | SMS, email, and app push |
| API access | REST API included |
| Warranty | 2 years hardware and 1 year cloud support |
Procurement Notes
The quoted EPC range of USD 1,920-2,496 is intended for standard 9 ha layouts with accessible pond banks, typical cable runs, and available WiFi/Ethernet backhaul. Final pricing can change when projects require marine-grade stainless mounting, additional gateways, 4G backup, higher solar autonomy, extended cable trenching, multilingual dashboards, or integration with more than 9 aerator circuits.
Procurement teams should confirm 6 details before purchase: species, stocking density, salinity range, existing aerator voltage, site-network availability, and preferred alert recipients. A complete request with these 6 inputs allows SOLARTODO to refine sensor selection, control thresholds, cable lengths, enclosure ratings, and commissioning steps for the specific 9 ha aquaculture site.
Source Notes
Authoritative references used for this specification include FAO aquaculture water-quality guidance, IEC 60529 ingress protection, IEC 61724-1 PV monitoring terminology, IEEE 802.3 Ethernet standards, IRENA renewable-energy transition analysis, IEA energy digitalization analysis, and LoRa Alliance agriculture connectivity references for comparison with LPWAN alternatives. These 7 source categories support the engineering basis, but final biological thresholds must be validated by local aquaculture experts for the target species and water chemistry.
Technical Specifications
| Coverage Area | 9ha |
| Application | Aquaculture fish farm |
| Pond Count | 9ponds |
| Monitoring Types | Water quality |
| Total Sensors | 9sensors |
| Measured Parameters | DO, pH, ammonia, turbidity, salinity, temperature |
| Communication | WiFi/Ethernet |
| Power Supply | Solar medium with LFP battery |
| Data Interval | 10, configurable 1-60min |
| Cloud Platform | Professional |
| Aerator Control | Included, threshold-based |
| Alert Channels | SMS, Email, App Push |
| API Access | REST API included |
| Hardware Warranty | 2years |
| Cloud Warranty | 1year |
Price Breakdown
| Item | Quantity | Unit Price | Subtotal |
|---|---|---|---|
| IP68 water-quality sensor node | 9 pcs | $95 | $855 |
| WiFi/Ethernet IoT gateway | 1 pcs | $110 | $110 |
| Solar-medium power kit, 80 W class | 1 pcs | $225 | $225 |
| Aerator control relay module | 9 pcs | $25 | $225 |
| Outdoor enclosure, mounting, and cabling kit | 1 pcs | $120 | $120 |
| Professional cloud platform, 1 year | 9 pcs | $48 | $432 |
| Engineering, layout design, and QC | 1 pcs | $120 | $120 |
| Installation, commissioning, and training | 1 pcs | $130 | $130 |
| 1-Year warranty and remote support | 1 pcs | $150 | $150 |
| Total Price Range | $1,920 - $2,496 | ||
Frequently Asked Questions
What does the Aquaculture Fish Farm 9ha system monitor?
How does automatic aerator control work?
What is included in the EPC turnkey price and warranty?
Can the system work during network interruptions?
Is this system suitable for shrimp or brackish-water aquaculture?
Certifications & Standards



Data Sources & References
- •FAO Fisheries and Aquaculture Technical Paper water-quality reference values
- •IEC 61724-1:2021 Photovoltaic system performance monitoring
- •IEC 60529 ingress protection rating framework
- •IEEE 802.3 Ethernet Working Group standards
- •IRENA World Energy Transitions Outlook 2025
- •IEA energy digitalization and renewables analysis
- •LoRa Alliance smart agriculture connectivity references
Interested in this solution?
Contact us for a customized quote based on your specific requirements.
Contact Us