VPP Economics 2026: MEA Aggregated Storage Revenue
SOLARTODO Editorial Team
Solar Energy & Infrastructure Expert Team
Watch the video
TL;DR
In 2026, virtual power plant projects in Middle East & Africa work best when aggregated storage earns from multiple services instead of one. Indicative revenue stacks range from $58-$146/kW-year, installed battery costs trend around $280-$420/kWh, and payback is often 4-7 years in Gulf and diesel-offset projects. The strongest cases combine LFP batteries, clear interconnection rules, and EPC execution that protects dispatch revenue.
Virtual power plant economics in Middle East & Africa are improving as aggregated storage revenue stacks reach roughly $58-$146/kW-year in 2026, while utility-scale battery capex trends near $280-$420/kWh and fast-response services settle in sub-second ranges.
Summary
Virtual power plant economics in Middle East & Africa are improving as aggregated storage revenue stacks reach roughly $58-$146/kW-year in 2026, while utility-scale battery capex trends near $280-$420/kWh and fast-response services settle in sub-second ranges.
Key Takeaways
- Prioritize revenue stacking because single-service battery projects in Middle East & Africa often yield only $18-$52/kW-year, while stacked VPP models can reach $58-$146/kW-year in 2026.
- Size aggregated storage portfolios around 1C power capability for frequency services, because assets with 0.5C-1C response can access higher-value ancillary markets with sub-second dispatch.
- Compare regional spreads carefully: Gulf Cooperation Council markets show indicative 2026 stacked revenue of $74-$146/kW-year, while parts of Africa remain closer to $58-$109/kW-year due to market design limits.
- Use LFP battery assumptions of 6,000+ cycles, 90% depth of discharge, and 88-92% round-trip efficiency when modeling 10-year VPP cash flow and warranty risk.
- Reduce imbalance and diesel support costs by aggregating commercial and industrial batteries, where avoided peak charges and backup fuel can improve payback from 7-10 years down to 4-7 years.
- Evaluate telecom, hotel, mining, and C&I loads first, because 100kW-10MW aggregated portfolios usually provide faster dispatch data and clearer savings than fragmented residential fleets in MEA.
- Procure under three pricing tiers—FOB, CIF, and EPC Turnkey—and apply volume discounts of 5% at 50+ units, 10% at 100+, and 15% at 250+ units to lower project IRR thresholds.
- Verify compliance with IEEE 1547, IEC 62933, UL 9540, and local grid-code requirements, because interconnection delays of 3-9 months can erase 1 full year of projected ancillary-service revenue.
Virtual Power Plant Economics in Middle East & Africa
Virtual power plant economics in Middle East & Africa in 2026 depend on stacking 2-4 revenue streams, with aggregated storage portfolios typically modeled at $58-$146/kW-year and payback windows of 4-10 years.
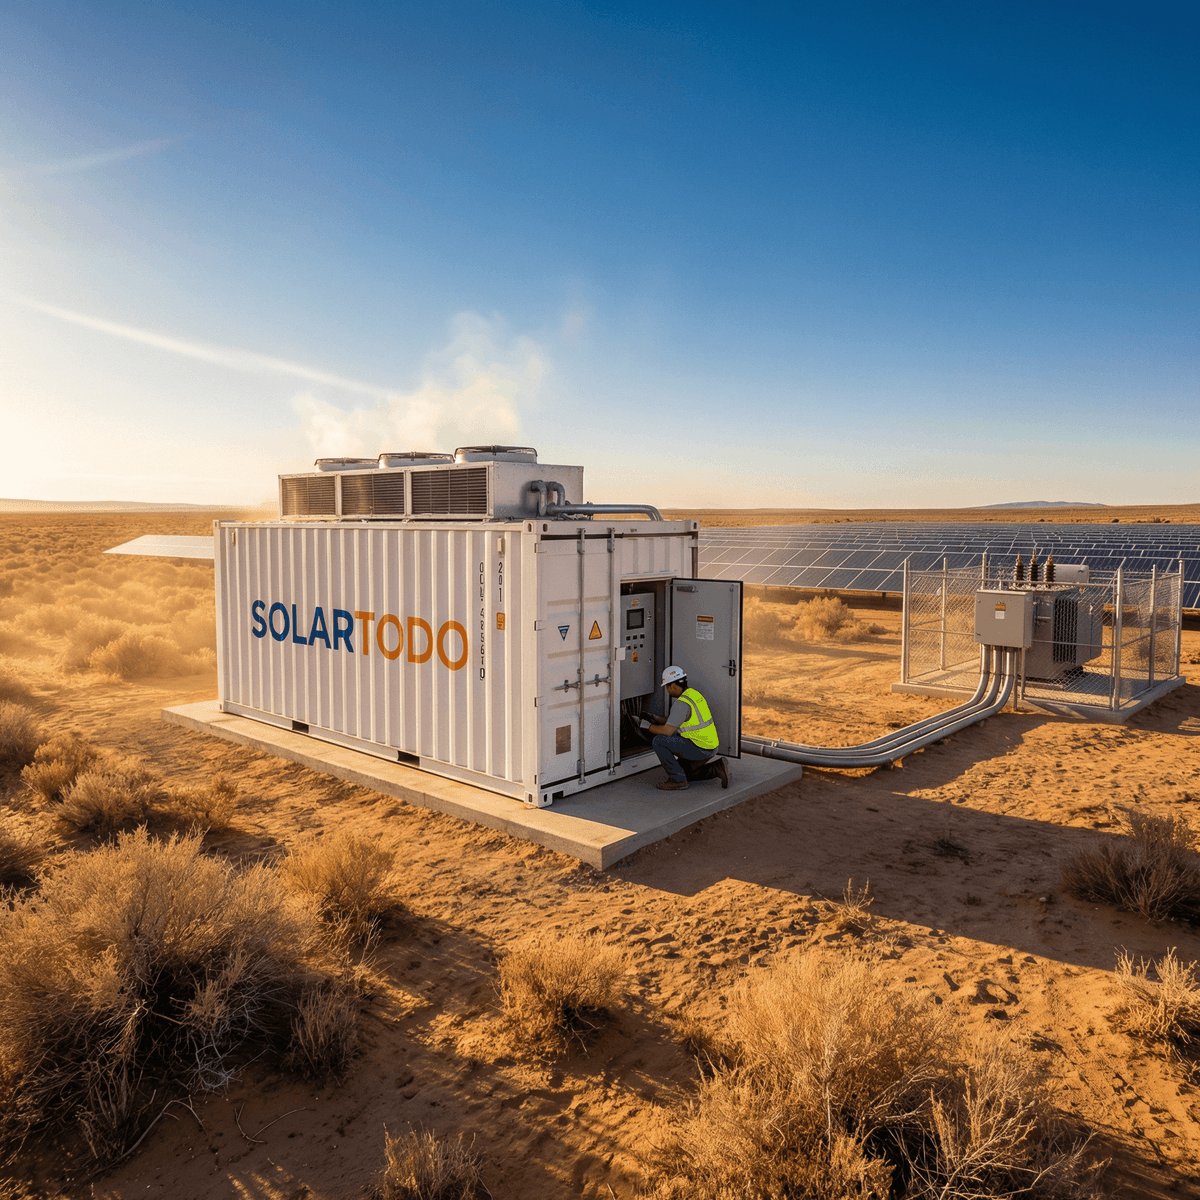
A virtual power plant, or VPP, is a software-coordinated network of distributed energy resources such as battery energy storage system assets, solar PV, backup generators, controllable HVAC, and flexible industrial loads. In MEA, the most bankable VPP cases in 2026 are not purely residential. They are usually commercial and industrial portfolios between 5MW and 100MW, because these fleets already have interval metering, SCADA visibility, and dispatchable battery power from 100kW to 10MW per site.
According to the International Energy Agency (IEA) (2024), power systems with higher shares of variable renewables require more short-duration flexibility and faster balancing resources. According to IRENA (2024), battery storage deployment is accelerating globally as grids seek flexibility, congestion relief, and renewable integration. For MEA buyers, the economic question is simple: can aggregated storage earn more than a site-by-site battery used only for backup or peak shaving? In many cases, the answer in 2026 is yes, but only where market rules permit dispatch and settlement at 5-minute to 30-minute intervals.
The strongest revenue logic appears in Gulf markets with high cooling loads, rising solar penetration, and utility interest in ancillary services. Africa offers a different case. Many projects there combine avoided diesel costs of $0.25-$0.60/kWh with grid support and demand management, creating hybrid VPP economics rather than pure merchant revenue. SOLAR TODO sees this pattern across hotel, telecom, mining, and mixed C&I inquiries where resilience and OPEX reduction matter as much as market participation.
What drives VPP revenue in 2026
VPP revenue in 2026 is driven mainly by frequency response, demand charge reduction, capacity value, and avoided diesel or curtailment costs, with each stream often contributing $10-$55/kW-year.
A battery energy storage system inside a VPP earns money only if dispatch signals align with tariff or market structure. In the Gulf, frequency containment and reserve-style services can be the first value layer. In commercial buildings, demand charge reduction can add another layer. In weak-grid African markets, avoided generator runtime and reduced fuel logistics often provide the base case.
According to NREL (2024), storage economics improve materially when multiple value streams are stacked rather than optimized for one service. BloombergNEF (2024) also notes that battery system costs continue to decline, although installed costs vary widely by integration level, thermal management, and local EPC conditions. For 2026 MEA modeling, a practical bankability range for installed LFP systems is about $280-$420/kWh for larger front-of-meter or aggregated C&I projects, with higher figures in remote logistics environments.
2021-2040 Revenue Trend Analysis
Middle East & Africa aggregated storage economics show a clear upward trend from 2021 to 2026, with broader VPP revenue pools expected to deepen again by 2027-2030 as ancillary-service rules mature.
The last 5 years show why 2026 matters. In 2021, many MEA battery projects were justified mainly on backup power and pilot-grid support, with limited formal market access. By 2023 and 2024, more utilities and regulators began testing flexibility procurement, renewable balancing, and digital dispatch. By 2026, the commercial case improves because battery capex is lower, telemetry is better, and tariff pressure is higher.
| Year | Typical MEA aggregated storage revenue ($/kW-year) | Installed battery capex ($/kWh) | Main value driver |
|---|---|---|---|
| 2021 | 28-71 | 420-620 | Backup, diesel offset, pilot peak shaving |
| 2023 | 39-96 | 340-520 | Peak shaving, reserve pilots, hybrid microgrids |
| 2025 | 51-128 | 300-450 | Frequency support, C&I demand management |
| 2026 | 58-146 | 280-420 | Stacked VPP dispatch, reserve, capacity, diesel avoidance |
| 2030 | 76-182 | 220-340 | Mature flexibility markets, wider aggregation |
| 2040 | 95-240 | 170-290 | AI dispatch, transactive flexibility, deeper DER penetration |
These figures are indicative ranges synthesized from public battery cost and flexibility market trends rather than a single market tariff. According to IEA (2024), grid flexibility needs rise sharply as solar and wind shares increase. According to Wood Mackenzie (2024), battery deployments are shifting from standalone arbitrage toward multi-service applications. That trend is especially relevant in MEA, where market design is still uneven.
The long-term outlook to 2040 depends on three scenarios. In a conservative scenario, batteries remain mostly behind-the-meter and revenue stays below $120/kW-year in many African markets. In a base scenario, ancillary-service procurement expands and digital aggregation lowers operating costs by 15-25%. In an accelerated scenario, capacity payments, dynamic tariffs, and renewable curtailment management combine to push large VPP fleets above $200/kW-year in selected markets.
The International Energy Agency states, "Battery storage is becoming a key source of power system flexibility." That statement matters in MEA because flexibility has a direct monetary value where solar output is growing faster than thermal ramping capability. IRENA states, "Renewables competitiveness has reached unprecedented levels," which supports the case for pairing solar with dispatchable storage rather than adding only peaking fuel assets.
Regional Revenue Data by Middle East & Africa
Regional VPP revenue in 2026 is highest in Gulf power systems at $74-$146/kW-year, while North Africa, Sub-Saharan Africa, and islanded weak-grid markets typically cluster between $58 and $127/kW-year.
The MEA region is not one market. Procurement teams need separate assumptions for Gulf utilities, North African grids, Sub-Saharan weak-grid networks, and diesel-heavy remote sites. Settlement intervals, reserve products, and tariff transparency vary widely, so revenue stacking logic must be localized.
| Region | 2026 stacked VPP revenue ($/kW-year) | Typical battery use case | Payback range | Key constraint |
|---|---|---|---|---|
| GCC / Gulf | 74-146 | Frequency support, peak shaving, solar balancing | 4-7 years | Market access and utility dispatch rules |
| North Africa | 63-121 | C&I demand management, renewable smoothing | 5-8 years | Tariff reform pace |
| Sub-Saharan Africa grid-connected | 58-109 | Backup replacement, peak shaving, reliability support | 5-9 years | Weak ancillary-service structures |
| Remote Africa / mining / telecom | 82-127 | Diesel offset, hybrid microgrid dispatch | 4-7 years | Fuel logistics and O&M capacity |
| Islanded / weak-grid MEA systems | 88-138 | Spinning reserve replacement, solar firming | 4-6 years | Limited technical standards enforcement |
Gulf markets benefit from high summer peaks, strong utility control systems, and rising solar additions. North Africa has better interconnection potential and utility-scale renewable growth, but tariff structures can still limit behind-the-meter monetization. In Sub-Saharan Africa, many projects are economic because they avoid outages and diesel consumption rather than because they clear a formal reserve market.
| Region | Peak tariff pressure | Diesel offset value ($/kWh) | Likely dispatch interval | Bankability outlook 2026 |
|---|---|---|---|---|
| GCC / Gulf | High in cooling season | 0.18-0.32 | 5-15 min | Strong for C&I and utility pilots |
| North Africa | Medium to high | 0.16-0.28 | 15-30 min | Moderate to strong |
| Sub-Saharan Africa | Medium | 0.25-0.60 | 15-60 min | Strong in hybrid sites |
| Remote mining / telecom | Low tariff, high fuel cost | 0.30-0.60 | Event-based | Strong if logistics are costly |
| Islanded systems | High system balancing value | 0.28-0.55 | Sub-second to 15 min | Strong where reserve is expensive |
For procurement managers, the implication is practical. A 20MW aggregated portfolio in the Gulf may justify a merchant-style dispatch layer. A 20MW portfolio in East or West Africa may need 50-70% of its value from avoided diesel, outage reduction, or contracted capacity support. SOLAR TODO typically advises buyers to separate market revenue from operational savings before calculating IRR.
Technology and Asset Mix for Aggregated Storage Portfolios
The most financeable MEA VPP portfolios in 2026 use LFP battery energy storage system assets with 6,000+ cycles, 88-92% round-trip efficiency, and 0.5C-1C power ratios.
LFP remains the preferred chemistry for most MEA aggregated storage projects because thermal stability, cycle life, and cost are more important than maximum energy density. A typical commercial asset in a VPP may operate at 1-2 cycles per day, though frequency-response-heavy fleets can cycle more often in partial depth windows. Liquid cooling becomes more relevant in Gulf ambient conditions above 40°C, while cabinetized air-cooled systems can still work for moderate-duty C&I sites if derating is accepted.
| Asset type | Typical size | Revenue role | Technical benchmark |
|---|---|---|---|
| C&I battery energy storage system | 100kW-2MW / 200kWh-4MWh | Peak shaving, reserve, backup | 90% DoD, 6,000+ cycles |
| Utility-scale battery block | 5MW-50MW / 10MWh-100MWh | Frequency response, capacity, solar balancing | 90% round-trip efficiency |
The control layer is as important as the battery. IEEE 1547-2018 matters for interconnection behavior in distributed energy resources. IEC 62933 provides a framework for electrical energy storage systems. UL 9540 and UL 9540A are often referenced for system safety and fire testing, even where local adoption is incomplete. In practice, projects without clear telemetry, metering, and dispatch verification lose 10-20% of modeled revenue because performance cannot be settled accurately.
SOLAR TODO product classes relevant to MEA VPP portfolios include the 10MWh Grid Frequency Regulation BESS for utility flexibility, the 200kWh Mining Site Off-Grid LFP for hybrid remote assets, and the 150kWh Hotel Demand Management LFP for commercial peak shaving fleets. These are not interchangeable. The 10MW/10MWh class fits sub-second regulation; the 100kW/200kWh class fits diesel reduction and renewable shifting; the 75kW/150kWh class fits interval demand management.
EPC Investment Analysis and Pricing Structure
EPC economics for MEA storage portfolios are most competitive when buyers compare FOB, CIF, and EPC Turnkey pricing side by side, with volume discounts reaching 15% at 250+ units.
For VPP projects, EPC means more than battery supply. It usually includes electrical design, protection coordination, SCADA integration, EMS configuration, civil works, commissioning, and performance testing. For aggregated fleets, EPC scope may also include communications gateways, revenue-grade meters, and API links to the VPP platform.
| Pricing tier | What is included | Indicative use |
|---|---|---|
| FOB Supply | Battery energy storage system, PCS, BMS, standard documentation | Buyers with local EPC capability |
| CIF Delivered | FOB scope plus ocean freight and insurance | Importers managing local installation |
| EPC Turnkey | Supply, design, installation, commissioning, training, grid coordination | Utility, C&I, and portfolio developers |
A practical 2026 pricing framework for MEA buyers is as follows. FOB is usually the lowest upfront option but shifts installation and interface risk to the buyer. CIF reduces logistics uncertainty but still leaves civil, electrical, and interconnection work local. EPC Turnkey has the highest contract value, yet it often lowers total project risk by reducing integration errors that can delay revenue by 3-9 months.
Volume pricing guidance for standardized fleets is:
- 50+ units: about 5% discount
- 100+ units: about 10% discount
- 250+ units: about 15% discount
Typical payment terms are:
- 30% T/T deposit and 70% against B/L
- 100% L/C at sight for qualified transactions
Financing is available for large projects above $1,000K, subject to project structure, offtake quality, and jurisdiction review. For EPC and pricing discussions, contact [email protected]. SOLAR TODO supports offline quotation rather than online checkout, which is more suitable for projects with grid-code, logistics, and EMS integration variables.
A sample economic view helps. If a 20MWh aggregated fleet costs $6.4 million at $320/kWh installed and earns blended net value of $2.1 million per year from reserve, demand savings, and diesel offset, simple payback is about 3.0 years before financing and O&M adjustments. If the same fleet earns only $1.0 million per year because one revenue stream is unavailable, payback extends to about 6.4 years. That spread is why contract structure matters more than nominal battery price alone.
Procurement Criteria and Selection Guide
The best 2026 procurement strategy is to select VPP assets by dispatch value, interconnection readiness, and local O&M capability rather than by battery $/kWh alone.
Procurement teams should compare at least five variables: power-to-energy ratio, thermal design, communications protocol support, warranty throughput, and local service coverage. A battery selected only for backup duty may underperform in a VPP if its PCS cannot follow 1-second or sub-second setpoints. Likewise, a low-cost imported cabinet can become expensive if replacement parts take 12-16 weeks to arrive.
| Selection factor | Why it matters | Target benchmark |
|---|---|---|
| Power-to-energy ratio | Determines service suitability | 0.5C-1C for VPP flexibility |
| Round-trip efficiency | Affects net revenue | 88-92% typical for LFP systems |
| Cycle life | Affects 10-year cash flow | 6,000+ cycles |
| Control response | Affects ancillary qualification | <1 second preferred |
| Warranty structure | Affects lender confidence | 10 years or defined throughput |
| Ambient temperature design | Affects derating in MEA | Up to 45-50°C site planning |
For many MEA portfolios, the first aggregation candidates are not households. They are telecom towers, hotels, malls, cold storage, mining camps, and industrial feeders. These sites often already have interval data, backup power history, and identifiable peak events. That reduces forecasting error and shortens diligence cycles.
FAQ
Virtual power plant buyers in MEA usually ask about revenue certainty, battery life, EPC scope, and interconnection timing, with most bankable answers depending on 4-10 year payback and 6,000+ cycle LFP assumptions.
Q: What is a virtual power plant in the context of aggregated storage? A: A virtual power plant is a software-controlled group of distributed assets that dispatch like one resource. In MEA, it often combines batteries, solar PV, generators, and flexible loads across 5MW-100MW portfolios to provide reserve, peak shaving, or reliability support.
Q: How much revenue can aggregated storage earn in Middle East & Africa in 2026? A: Indicative stacked revenue is about $58-$146/kW-year in 2026, depending on region and market access. Gulf projects tend to sit at the upper end because they can combine peak management, reserve value, and solar balancing more easily than weak-grid markets.
Q: Why is revenue stacking important for VPP economics? A: Revenue stacking matters because one service alone often does not cover battery capex and O&M. A project earning only $18-$52/kW-year from a single service may struggle, while combined value streams can lift returns into a 4-7 year payback range.
Q: Which battery chemistry is most suitable for MEA VPP projects? A: LFP is usually the preferred chemistry because it offers 6,000+ cycles, about 90% depth of discharge, and better thermal stability than some alternatives. That matters in MEA climates where ambient temperatures can exceed 40°C and uptime is critical.
Q: What applications are most bankable in Africa versus the Gulf? A: In Africa, hybrid mining, telecom, and weak-grid commercial sites are often most bankable because avoided diesel at $0.25-$0.60/kWh creates immediate value. In the Gulf, commercial buildings and utility-linked portfolios benefit more from peak demand reduction and fast-response services.
Q: How long is the typical payback period for aggregated storage projects? A: Payback usually falls between 4 and 10 years in MEA. Projects with diesel offset, demand savings, and reserve revenue together often land at 4-7 years, while projects relying on only one tariff-based value stream may extend to 7-10 years.
Q: What does EPC Turnkey include for a battery energy storage system portfolio? A: EPC Turnkey usually includes design, equipment supply, civil and electrical works, SCADA and EMS setup, commissioning, and training. For VPP fleets, it should also include communications gateways, revenue-grade metering, and dispatch testing so settlement data is auditable.
Q: What are the common pricing and payment terms from SOLAR TODO? A: SOLAR TODO typically supports FOB Supply, CIF Delivered, and EPC Turnkey structures. Standard payment terms are 30% T/T plus 70% against B/L, or 100% L/C at sight, with financing available for projects above $1,000K and volume discounts up to 15%.
Q: How important are standards such as IEEE 1547 and UL 9540? A: They are important because interconnection and safety compliance directly affect project approval and insurer confidence. IEEE 1547 supports distributed resource interoperability, while UL 9540 and related fire-test frameworks help define battery system safety and enclosure acceptance.
Q: Can hotel, mining, and telecom batteries participate in one VPP fleet? A: Yes, if the EMS can normalize telemetry, state of charge, and dispatch priorities across different sites. Mixed fleets are common in MEA because a 150kWh hotel unit, a 200kWh mining hybrid unit, and larger utility blocks can each contribute different flexibility services.
Q: What is the main risk to VPP economics in MEA? A: The main risk is not always battery hardware cost. It is often market design, dispatch rights, and settlement visibility. A technically sound battery can still underperform financially if interconnection takes 6 months longer than planned or ancillary products are not contractually defined.
Q: When should a buyer choose a utility-scale 10MWh system instead of smaller distributed units? A: Choose a 10MWh class system when sub-second frequency response, AGC following, or feeder-level balancing is the main value stream. Choose smaller distributed units when diesel offset, site resilience, and behind-the-meter savings are a larger share of the business case.
Conclusion
Virtual power plant economics in Middle East & Africa are strongest in 2026 when aggregated storage captures at least 2-3 value streams, pushing revenue toward $58-$146/kW-year and payback toward 4-7 years.
The bottom line is clear: for MEA buyers, a battery energy storage system portfolio becomes financeable when dispatch software, local tariff structure, and EPC execution are aligned. SOLAR TODO recommends modeling revenue by region, separating market income from operational savings, and procuring assets that match the actual dispatch duty rather than the lowest nominal $/kWh.
References
- International Energy Agency (IEA) (2024): World Energy Outlook 2024 and grid flexibility analysis on storage and renewable integration.
- International Renewable Energy Agency (IRENA) (2024): Renewable Capacity Statistics and storage-related renewable integration data.
- National Renewable Energy Laboratory (NREL) (2024): Storage valuation and stacked revenue methodology for distributed and grid-scale batteries.
- BloombergNEF (2024): Battery price survey and energy storage market outlook for global installed cost trends.
- Wood Mackenzie (2024): Global energy storage outlook and market design trends affecting ancillary-service revenue.
- IEEE 1547-2018 (2018): Standard for interconnection and interoperability of distributed energy resources with electric power systems interfaces.
- IEC 62933 series (2023): Electrical energy storage system standards covering performance and system considerations.
- UL 9540 / UL 9540A (2023): Energy storage system safety standard and thermal runaway fire test method.
About SOLARTODO
SOLARTODO is a global integrated solution provider specializing in solar power generation systems, energy-storage products, smart street-lighting and solar street-lighting, intelligent security & IoT linkage systems, power transmission towers, telecom communication towers, and smart-agriculture solutions for worldwide B2B customers.
Further Reading
About the Author

SOLARTODO Editorial Team
Solar Energy & Infrastructure Expert Team
SOLAR TODO is a professional supplier of solar energy, energy storage, smart lighting, smart agriculture, security systems, communication towers, and power tower equipment.
Our technical team has over 15 years of experience in renewable energy and infrastructure, providing high-quality products and solutions to B2B customers worldwide.
Expertise: PV system design, energy storage optimization, smart lighting integration, smart agriculture monitoring, security system integration, communication and power tower supply.
Cite This Article
SOLARTODO Editorial Team. (2026). VPP Economics 2026: MEA Aggregated Storage Revenue. SOLARTODO. Retrieved from https://solartodo.com/knowledge/virtual-power-plant-economics-2026-aggregated-storage-revenue-data-by-middle-east-africa
@article{solartodo_virtual_power_plant_economics_2026_aggregated_storage_revenue_data_by_middle_east_africa,
  title = {VPP Economics 2026: MEA Aggregated Storage Revenue},
  author = {SOLARTODO Editorial Team},
  journal = {SOLARTODO Knowledge Base},
  year = {2026},
  url = {https://solartodo.com/knowledge/virtual-power-plant-economics-2026-aggregated-storage-revenue-data-by-middle-east-africa},
  note = {Accessed: 2026-07-15}
}
Published: July 5, 2026 | Available at: https://solartodo.com/knowledge/virtual-power-plant-economics-2026-aggregated-storage-revenue-data-by-middle-east-africa
Subscribe to Our Newsletter
Get the latest solar energy news and insights delivered to your inbox.
View All Articles