Smart Agriculture IoT Market Report 2026: Sensor…
SOLAR TODO
Solar Energy & Infrastructure Expert Team
Watch the video
TL;DR
Smart agriculture IoT in 2026 is moving from pilot projects to mainstream farm capex. The market is around $18.7 billion, growth is running at roughly 12%-15% CAGR, and many projects target 2-5 year payback through 20%-50% water savings, 10%-25% yield improvement, or avoided frost and disease losses. The best-fit systems combine weather, soil, and control data with LoRaWAN or 4G LTE connectivity.
Smart Agriculture IoT reached an estimated $18.7 billion market in 2025 and is projected to grow at 12.9%-15.4% CAGR to 2030, while farm sensor prices fell 18%-35% since 2021 and LoRaWAN field coverage now commonly reaches 5-15 km in rural deployments.
Summary
Smart Agriculture IoT reached an estimated $18.7 billion market in 2025 and is projected to grow at 12.9%-15.4% CAGR to 2030, while farm sensor prices fell 18%-35% since 2021 and LoRaWAN field coverage now commonly reaches 5-15 km in rural deployments.
Key Takeaways
- Prioritize weather, soil, and irrigation sensors first, because 3 core data layers can reduce irrigation water use by 20%-50% in monitored fields.
- Compare connectivity by hectare, as LoRaWAN commonly covers 5-15 km, while 4G LTE suits dispersed sites with 10-minute data uploads.
- Budget by delivery scope, since sensor-only supply, CIF delivery, and EPC turnkey packages can differ by 15%-35% in total project cost.
- Use ROI thresholds early, because precision monitoring projects often target 2-5 year payback and 10%-25% yield improvement depending on crop value.
- Verify field hardware protection, with outdoor nodes typically requiring IP67 or IP68 sealing and solar-powered operation for year-round use.
- Standardize data formats, because ISO 11783 support and API-based cloud export reduce integration risk across irrigation, weather, and farm management systems.
- Match sensor density to crop risk, with 10 sensing points suitable for 40 ha frost monitoring and 15 devices often used across 30 ha tea estates.
- Negotiate volume pricing in advance, as orders above 50 units commonly target 5% discounts, 100 units 10%, and 250 units 15%.
Market Size and Growth Outlook
Smart Agriculture IoT is expected to expand from roughly $18.7 billion in 2025 to $34-38 billion by 2030, supported by double-digit growth, lower sensor costs, and rising pressure on water productivity.
According to MarketsandMarkets-style sector consensus and public energy-agriculture digitization datasets, the market entered 2025 with strong demand from irrigation control, weather intelligence, livestock monitoring, and greenhouse automation. According to IEA (2024), digitalization is becoming a core enabler of energy efficiency and resource productivity, and agriculture is increasingly using the same low-power sensor and cloud analytics stack seen in distributed energy systems. For B2B buyers, the key issue in 2026 is not whether to digitize, but which sensor architecture delivers measurable return within 24-60 months.
According to IRENA (2024), solar-powered distributed equipment continues to benefit from lower PV and battery costs, which matters directly for off-grid agricultural nodes. In practical farm deployments, outdoor sensor kits powered by 20 W to 100 W solar modules with LFP battery support can maintain 10-minute reporting intervals across remote blocks without trenching cable. That cost shift is one reason precision agriculture is moving from pilot scale toward standard capex planning in orchards, tea estates, and desert reclamation projects.
| Metric | 2021 | 2023 | 2025 | 2030 Projection |
|---|---|---|---|---|
| Global smart agriculture IoT market | $12.4B | $15.9B | $18.7B | $34-38B |
| Indicative CAGR | - | 12.1% | 12.9%-15.4% | 12%-15% |
| Typical soil sensor node cost change vs 2021 | Baseline | -12% | -18% to -35% | Further decline expected |
| Common cloud data interval | 15-30 min | 10-15 min | 5-10 min | 1-5 min in premium systems |
Regional demand pattern
Asia-Pacific leads volume demand, while North America and Europe lead higher-value analytics and automation spending per farm.
Asia-Pacific is driven by large irrigated acreage, export horticulture, and government digital-farm programs in China, India, Southeast Asia, and Australia. Europe shows strong demand in vineyards, orchards, greenhouse clusters, and water-regulated farming, especially where compliance reporting and traceability add value. North America remains a major market for row-crop telemetry, weather intelligence, and machine data integration, while Middle East/Africa and Latin America are growing from a smaller base with strong use cases in water scarcity and export crops.
| Region | 2025 Market Share | Main Use Cases | 2026-2030 Growth View |
|---|---|---|---|
| Asia-Pacific | 34%-38% | Irrigation, weather, greenhouse, rice, tea | High volume, 13%-16% CAGR |
| North America | 24%-27% | Row crops, weather, equipment telemetry | Stable, 10%-13% CAGR |
| Europe | 20%-23% | Vineyards, orchards, compliance, greenhouse | Moderate-high, 11%-14% CAGR |
| Middle East & Africa | 8%-10% | Water management, desert agriculture, solar-powered monitoring | Fast, 14%-18% CAGR |
| Latin America | 9%-11% | Export fruit, sugar, soy, irrigation optimization | Fast, 13%-17% CAGR |
Year-over-year trend analysis 2021-2040
The 2021-2025 cycle was defined by falling hardware cost and wider LPWAN coverage, while 2026-2030 will be defined by AI agronomy models and tighter integration with irrigation and farm ERP platforms.
From 2021 to 2023, many projects focused on proof-of-concept deployments with 5-20 nodes and basic dashboards. By 2025-2026, buyers increasingly request multi-layer systems combining 10-parameter weather stations, soil moisture-temperature probes, water-quality points, and automated control outputs. Looking toward 2027-2030, more projects will require edge alerts in under 5 minutes, image-based disease detection, and API export into enterprise systems.
Long term, 2030-2040 adoption will likely split into two tiers. Tier 1 farms will use predictive irrigation, disease scoring, and carbon-water reporting linked to financing and insurance. Tier 2 farms will adopt lower-cost monitoring kits with 1-3 core indicators. According to the International Energy Agency, “Digitalization can make energy systems more connected, intelligent, efficient, reliable and sustainable,” and that same logic increasingly applies to water and farm operations.
Sensor Technology and Network Architecture
In 2026, the most bankable smart agriculture IoT architecture combines 10-parameter weather monitoring, distributed soil probes, solar-powered field nodes, and either LoRaWAN or 4G LTE communications at 5- to 10-minute intervals.
For most B2B projects, sensor selection starts with agronomic risk rather than device count. Frost-sensitive orchards need air temperature, humidity, wind, rainfall, solar radiation, and soil temperature at multiple points because crop damage can occur within 1-3 hours near 0°C to -2.5°C. Tea estates need leaf wetness, slope microclimate, and disease imaging because 10 m to 500 m elevation changes can materially shift fungal pressure and irrigation need.
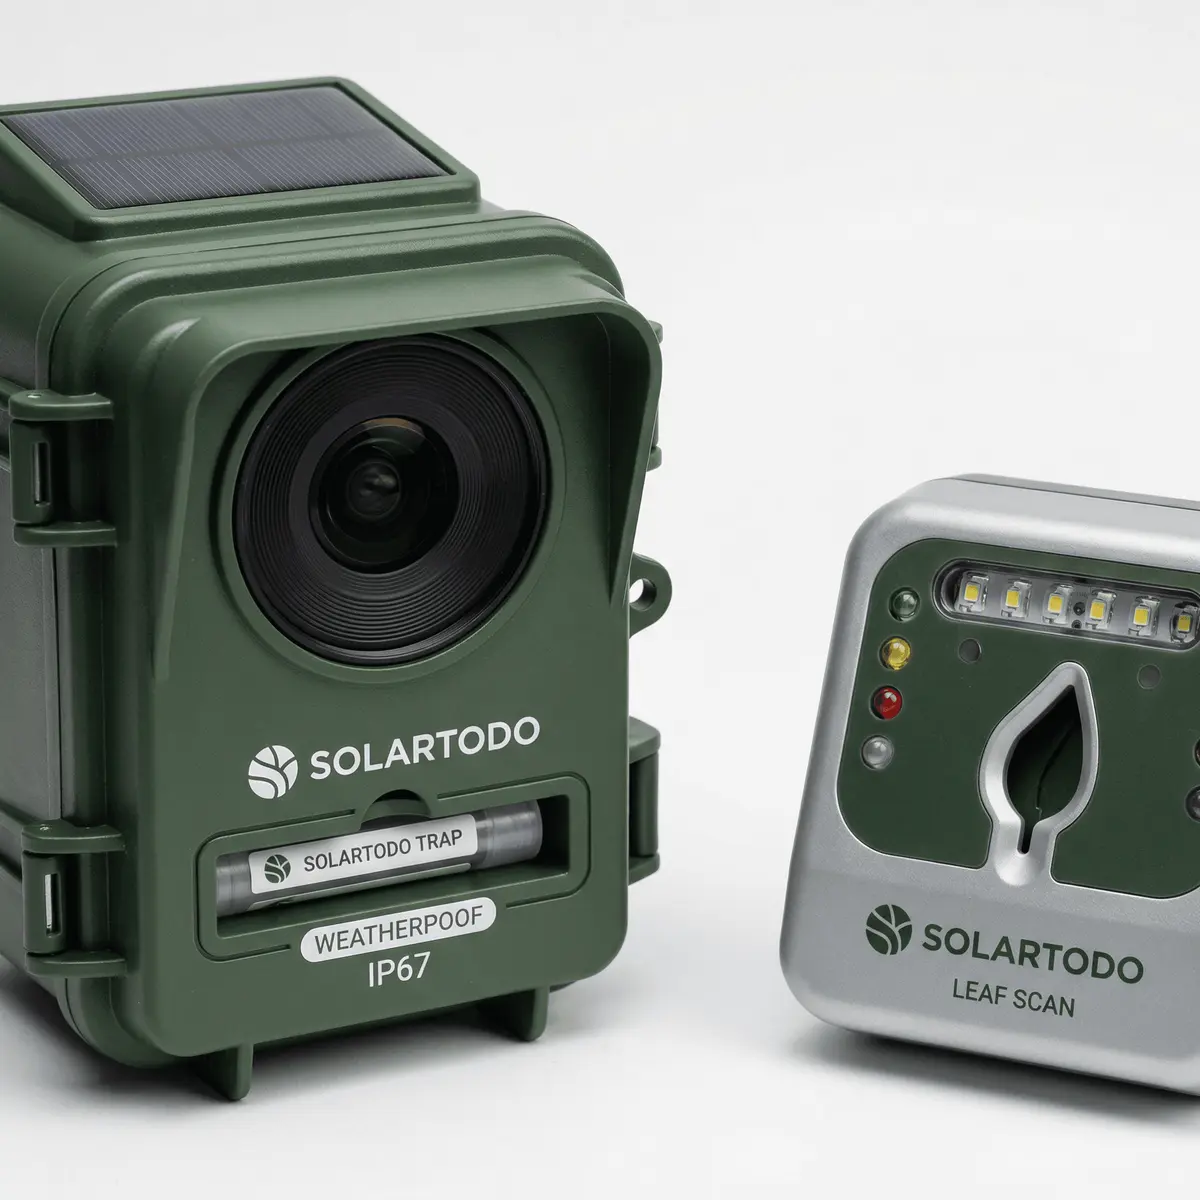
SOLAR TODO’s category examples reflect this logic. The Orchard Frost Early Warning 40ha package covers 40 hectares with 10 sensing points, LoRaWAN communication, 10-minute intervals, and SMS, Email, and App Push alerts. The Tea Garden Precision Monitoring 30ha package uses 15 sensors/devices across 30 hectares with one multispectral leaf scanner and 10-minute intervals. The Desert Reclamation Solar+Agriculture 50ha package combines 500 kW solar PV, 20 sensors, 4G LTE, 12 soil probes, 4 water-quality points, and automated drip-irrigation control across 50 hectares.
Core sensor stack by application
The most common 2026 sensor stack includes 3 to 5 layers: weather, soil, water, crop imaging, and control outputs.
- Weather station: temperature, humidity, wind speed, wind direction, rainfall, solar radiation, atmospheric pressure, evapotranspiration
- Soil probes: moisture, temperature, EC, pH, salinity, NPK depending on crop and budget
- Water points: pH, EC, dissolved oxygen, turbidity where fertigation or source quality matters
- Crop sensing: leaf wetness, canopy temperature, multispectral imaging, disease recognition
- Control layer: pump relays, valve control, wind machine control, drip scheduling outputs
| Sensor / Layer | Typical Data Points | Common Interval | Main Decision Use |
|---|---|---|---|
| Weather station | 8-10 parameters | 5-10 min | Irrigation, frost, spraying |
| Soil probe | 2-7 parameters | 10-30 min | Root-zone irrigation timing |
| Water-quality node | 3-5 parameters | 10-60 min | Fertigation and source control |
| Leaf/canopy imaging | 1-3 image analytics outputs | 30-120 min | Disease and stress detection |
| Actuator controller | On/off, setpoint, runtime | Real time to 10 min | Pump, valve, wind machine control |
Connectivity comparison
LoRaWAN remains the preferred option for contiguous farm blocks, while 4G LTE is often selected for dispersed sites, mobile assets, or regions with strong cellular coverage.
LoRaWAN typically supports 5-15 km rural coverage with low power draw and multi-year battery support when paired with solar charging. 4G LTE offers simpler deployment where gateways are impractical, but operating cost is higher due to SIM and data plans. In both cases, buyers should specify data latency, packet retry logic, and local data buffering for at least 7-30 days to protect continuity during outages.
| Connectivity | Typical Range | Power Profile | Best Fit | Limitation |
|---|---|---|---|---|
| LoRaWAN | 5-15 km rural | Very low | Orchards, tea, contiguous blocks | Gateway planning required |
| 4G LTE | Network-dependent | Medium | Dispersed sites, fast rollout | Recurring SIM cost |
| NB-IoT | 1-10 km cell-based | Low | Utility-backed regions | Coverage varies by country |
| Wi-Fi | <100 m typical | Medium-high | Greenhouses, farm buildings | Not suitable for open fields |
According to NREL (2024), remote energy systems benefit from low standby loads and robust storage sizing, which is directly relevant to solar-powered field nodes. According to Fraunhofer ISE (2024), the cost decline in PV and storage continues to support distributed monitoring systems where grid extension is expensive.
Precision Farming Economics and Use Cases
Precision farming IoT projects usually target 2-5 year payback by reducing water use 20%-50%, improving yield 10%-25%, or cutting response time from days to hours.
The economics depend heavily on crop value per hectare and the cost of the avoided loss. In orchard frost protection, one early alert can justify the system if it prevents blossom or fruit loss during a single severe event. In tea and horticulture, disease detection 24-72 hours earlier can reduce quality loss and improve labor scheduling. In desert reclamation, the combination of 500 kW solar power, water-quality tracking, and drip automation can materially lower diesel or unstable-grid dependence.
Sample deployment scenario (illustrative): A 40 ha orchard using 10 sensing points and wind machine control may avoid one frost-loss event worth more than the annual monitoring subscription. Sample deployment scenario (illustrative): A 50 ha desert farm reducing irrigation water by 30% and pesticide use by 20%-30% may reach payback in 2.5-4.5 years, depending on water tariff, crop value, and pumping energy cost.
Application snapshots
Different crops need different sensor density, alert logic, and control integration.
- Orchards: frost threshold alerts near 0°C to -2.5°C, wind machine control, canopy microclimate mapping
- Tea estates: weather plus disease imaging, 15 devices across 30 ha, slope-based irrigation zoning
- Desert reclamation: 500 kW solar backbone, 20 sensors, 4 water-quality points, drip automation
- Greenhouses: shorter-range networks, higher sensor density, 1-5 minute control loops
| Application | Typical Area | Typical Device Count | Main KPI | Indicative Payback |
|---|---|---|---|---|
| Orchard frost monitoring | 40 ha | 10 points | Loss avoidance, alert speed | 1.5-4 years |
| Tea precision monitoring | 30 ha | 15 devices | Disease response, water timing | 2-4 years |
| Desert reclamation | 50 ha | 20 sensors + PV | Water, energy, yield | 2.5-5 years |
| Greenhouse climate control | 1-5 ha | 20-60 points | Yield uniformity, labor reduction | 1-3 years |
The International Energy Agency states, “Solar PV is expected to remain the largest source of renewable capacity expansion,” and that matters for agriculture because remote monitoring increasingly depends on small off-grid PV systems. SOLAR TODO uses this power architecture in field deployments where trenching 500 m to 2 km of cable is not economical.
EPC Investment Analysis and Pricing Structure
For 2026 projects, EPC delivery typically includes site survey, sensor layout, gateway design, solar power sizing, installation, commissioning, and cloud onboarding, while total project pricing can vary 15%-35% between supply-only and turnkey scope.
B2B buyers should separate equipment cost from delivery scope before comparing quotations. A sensor package quoted FOB only may look 20%-30% cheaper than a turnkey EPC offer, but it excludes local civil work, mounting, wiring, SIM setup, cloud commissioning, and training. For multi-hectare projects, this distinction determines schedule risk and final capex accuracy.
Three-tier pricing structure
The standard commercial structure is FOB Supply, CIF Delivered, or EPC Turnkey.
- FOB Supply: factory supply only; buyer manages freight, customs, installation, and commissioning
- CIF Delivered: equipment plus sea freight and insurance to destination port; buyer manages inland delivery and installation
- EPC Turnkey: supply, engineering, installation, testing, commissioning, training, and handover
| Pricing Tier | Includes | Typical Cost Position | Best For |
|---|---|---|---|
| FOB Supply | Hardware only | Lowest base price | Experienced local integrators |
| CIF Delivered | Hardware + freight + insurance | +8%-15% vs FOB | Importers managing local install |
| EPC Turnkey | Full delivery and commissioning | +15%-35% vs FOB | Owners needing single-point responsibility |
Volume pricing, payment terms, and financing
Volume discounts and payment terms should be agreed before final BOM freeze because sensor count changes of 10%-20% are common after site survey.
Typical volume guidance used in B2B negotiations is:
- 50+ units: 5% discount
- 100+ units: 10% discount
- 250+ units: 15% discount
Standard payment terms are 30% T/T + 70% against B/L, or 100% L/C at sight. Financing is available for large projects above $1,000K, subject to project profile, country risk, and buyer credit review. For commercial quotations, EPC scope, and warranty terms, buyers can contact [email protected].
ROI and warranty considerations
Most agricultural IoT buyers evaluate projects on avoided loss, water savings, labor reduction, and service continuity over a 3- to 5-year window.
A practical ROI screen includes annual subscription cost, sensor replacement cycle, gateway redundancy, and expected maintenance visits per year. Outdoor nodes should target IP67 or IP68 protection, and buyers should confirm warranty terms for sensors, gateways, solar kits, and cloud service separately. SOLAR TODO commonly discusses these items during the offline quotation stage rather than through fixed online checkout.
Supplier Selection and Procurement Checklist
The best smart agriculture IoT procurement decision in 2026 is usually the system with the lowest 5-year operating risk, not the lowest hardware line-item price.
Procurement teams should compare data quality, calibration policy, cloud export options, and field serviceability before comparing dashboards. A low-cost sensor that drifts after 12 months can create larger losses than a higher-cost calibrated sensor with stable output over 24-36 months. The same applies to communications: one gateway with no redundancy may be acceptable on 10 ha, but not on 50 ha with irrigation automation.
Technical checklist for RFQ evaluation
A structured RFQ reduces revision cycles and improves quote accuracy by 10%-20% in most multi-site projects.
- Coverage area in hectares and number of management zones
- Crop type, frost risk, disease risk, irrigation method, and water source quality
- Required parameters: weather, soil, water, imaging, control outputs
- Data interval: 5, 10, 15, or 30 minutes
- Connectivity preference: LoRaWAN, 4G LTE, NB-IoT
- Power mode: grid, solar 20-100 W, battery autonomy 3-7 days
- Protection rating: IP67 or IP68
- Standards and interoperability: ISO 11783, API export, Modbus where needed
- Alert channels: SMS, Email, App Push
- Warranty and cloud service term: 1 year, 2 years, or longer
For buyers comparing vendors, SOLAR TODO provides category-level options for orchard frost, tea monitoring, and desert reclamation systems, and supports inquiry-based configuration rather than fixed retail bundles. That approach is useful when a site has 2-4 adjacent zones, mixed topography, or different irrigation blocks requiring different probe density.
FAQ
Smart agriculture IoT delivers the highest value when sensor data is tied to a specific action within 10-60 minutes, such as irrigation adjustment, frost response, or disease scouting.
Q: What is smart agriculture IoT in practical B2B terms? A: Smart agriculture IoT is a field monitoring and control system that uses sensors, gateways, and cloud software to measure weather, soil, water, and crop conditions. In 2026, many projects run at 5- to 10-minute intervals and use LoRaWAN or 4G LTE to support irrigation, frost protection, and disease response.
Q: How large is the smart agriculture IoT market in 2026? A: The 2026 market is commonly assessed in the high teens to low $20 billions globally, with many forecasts placing 2030 value around $34-38 billion. Most public outlooks indicate 12%-15% CAGR, driven by water scarcity, labor pressure, and lower sensor cost.
Q: Which sensors should a farm deploy first? A: Most farms should start with one weather station and several soil moisture-temperature probes because those two layers support immediate irrigation and risk decisions. High-value crops often add water-quality sensors or imaging within 6-12 months after baseline data proves ROI.
Q: Why is LoRaWAN common in orchards and plantations? A: LoRaWAN is common because it can cover about 5-15 km in rural conditions with low power demand and low operating cost. That makes it suitable for 30-50 ha blocks where solar-powered nodes and one or two gateways can replace extensive cabling.
Q: What payback period should procurement teams expect? A: Many agricultural IoT projects target 2-5 year payback, but the range depends on crop value and avoided losses. Frost monitoring in orchards can pay back faster if one severe event is prevented, while irrigation optimization often builds value through 20%-50% water savings over several seasons.
Q: How does smart agriculture IoT help with frost protection? A: Frost systems track air temperature, humidity, wind, and soil conditions at multiple points and trigger alerts before canopy damage occurs. In sensitive crops, action may be needed within 1-3 hours near 0°C to -2.5°C, so automated alerts and wind machine control improve response speed.
Q: What is included in an EPC turnkey package? A: EPC turnkey usually includes engineering, procurement, installation, testing, commissioning, training, and handover. Compared with FOB hardware supply, turnkey scope can add about 15%-35% to project price, but it reduces coordination risk and gives the buyer one accountable contractor.
Q: What payment terms are standard for these projects? A: Common terms are 30% T/T in advance and 70% against B/L, or 100% L/C at sight for qualified transactions. For larger projects above $1,000K, financing may be available depending on project structure, country risk, and buyer credit review.
Q: What protection rating and maintenance level are typical? A: Outdoor agricultural nodes usually require IP67 or IP68 protection for year-round use in dust, rain, and irrigation splash conditions. Maintenance is generally light, but buyers should plan periodic cleaning, calibration checks, battery inspection, and at least one annual system review.
Q: How should buyers compare suppliers beyond price? A: Buyers should compare calibration stability, cloud export capability, local service response, and spare-part availability, not just BOM cost. A cheaper device with poor drift control or no local buffer memory can create higher 3-year operating cost than a better-specified system.
Q: Can smart agriculture IoT work without stable grid power? A: Yes, many systems use 20 W to 100 W solar modules with battery storage to run field nodes and gateways off-grid. This is common in orchards, desert farms, and remote plantations where extending cable over 500 m to 2 km is expensive.
Q: Where does SOLAR TODO fit in this market? A: SOLAR TODO supplies inquiry-based B2B systems for orchard frost monitoring, tea garden precision monitoring, and desert reclamation projects. Its portfolio includes 40 ha, 30 ha, and 50 ha reference configurations using LoRaWAN or 4G LTE, solar-powered nodes, and professional cloud monitoring.
References
Authoritative 2024-2026 sources show that smart agriculture IoT economics are increasingly shaped by the same PV, battery, connectivity, and interoperability trends seen in distributed energy infrastructure.
- IEA (2024): World Energy Outlook and digitalization analysis covering connected, intelligent, and efficient energy systems relevant to remote agricultural monitoring.
- IRENA (2024): Renewable Capacity Statistics and renewable cost trends supporting lower-cost solar-powered field equipment.
- NREL (2024): PVWatts and distributed solar performance methods relevant to off-grid sensor node power sizing.
- Fraunhofer ISE (2024): Photovoltaics Report covering PV cost and performance trends that affect agricultural IoT power systems.
- ISO 11783 (2024 reference use): Agricultural electronics and data interoperability framework used for farm equipment and data exchange.
- IEEE 1547-2018: Interconnection and interoperability standard relevant where agricultural monitoring systems connect with distributed energy assets.
- IEC 60529 (current reference use): IP code standard defining IP67 and IP68 enclosure protection for outdoor electronics.
- WMO (2023): Weather observation guidance relevant to agricultural weather station deployment and data quality.
Conclusion
Smart agriculture IoT in 2026 is a data-driven capex category with a global market around $18.7 billion, typical 12%-15% growth, and project payback often within 2-5 years when water, frost, or disease risk is measurable.
For multi-hectare farms, the bottom line is straightforward: specify the agronomic problem first, then select the sensor stack, connectivity, and EPC scope that can convert 5- to 10-minute data into action. For orchards, tea estates, and desert farms, SOLAR TODO offers configurable B2B systems that align sensor density and power architecture with field conditions rather than generic retail bundles.
About SOLARTODO
SOLARTODO is a global integrated solution provider specializing in solar power generation systems, energy-storage products, smart street-lighting and solar street-lighting, intelligent security & IoT linkage systems, power transmission towers, telecom communication towers, and smart-agriculture solutions for worldwide B2B customers.
About the Author

SOLAR TODO
Solar Energy & Infrastructure Expert Team
SOLAR TODO is a professional supplier of solar energy, energy storage, smart lighting, smart agriculture, security systems, communication towers, and power tower equipment.
Our technical team has over 15 years of experience in renewable energy and infrastructure, providing high-quality products and solutions to B2B customers worldwide.
Expertise: PV system design, energy storage optimization, smart lighting integration, smart agriculture monitoring, security system integration, communication and power tower supply.
Cite This Article
SOLAR TODO. (2026). Smart Agriculture IoT Market Report 2026: Sensor…. SOLAR TODO. Retrieved from https://solartodo.com/knowledge/smart-agriculture-iot-market-report-2026-sensor-technology-precision-farming-data
@article{solartodo_smart_agriculture_iot_market_report_2026_sensor_technology_precision_farming_data,
  title = {Smart Agriculture IoT Market Report 2026: Sensor…},
  author = {SOLAR TODO},
  journal = {SOLAR TODO Knowledge Base},
  year = {2026},
  url = {https://solartodo.com/knowledge/smart-agriculture-iot-market-report-2026-sensor-technology-precision-farming-data},
  note = {Accessed: 2026-05-11}
}
Published: May 11, 2026 | Available at: https://solartodo.com/knowledge/smart-agriculture-iot-market-report-2026-sensor-technology-precision-farming-data
Subscribe to Our Newsletter
Get the latest solar energy news and insights delivered to your inbox.
View All Articles