Global Solar PV Installation Statistics 2026: Growth Rates…

Cinn Song
Founder & Chief Solutions Architect
Watch the video
TL;DR
Global solar PV is now a terawatt-scale infrastructure market: 2025 installations reached 510.3 GW by IRENA and more than 600 GW by IEA, with cumulative capacity around 2.8 TW. Buyers should evaluate regional policy risk, certified 22-25% modules, EPC scope, storage readiness, and 3-8 year C&I payback before procurement.
Global solar PV installations surpassed 510 GW in 2025, cumulative capacity reached about 2.8 TW in 2026 reporting, and policy shifts now move roughly 60% of utility renewables through auctions.
Summary
Global solar PV installations surpassed 510 GW in 2025, cumulative capacity reached about 2.8 TW in 2026 reporting, and policy shifts now move roughly 60% of utility renewables through auctions.
Key Takeaways
Solar PV installation strategy in 2026 should be based on 510-600 GW annual global additions, 22-25% commercial module efficiency, and policy-linked grid access risk.
- Track auction rules in China, Europe, India, and MENA because competitive procurement now covers almost 60% of expected utility-scale renewable additions from 2025-2030.
- Prioritize distributed C&I solar where retail tariffs exceed USD 0.10/kWh, because 50-500 kW systems can often recover capital in 3-7 years.
- Specify N-type TOPCon or HJT modules at 22-25% efficiency for rooftop and land-constrained projects where area productivity affects EPC cost.
- Add storage for high-curtailment or weak-grid markets because IEA expects solar and wind curtailment to rise as VRE shares approach 27% by 2030.
- Compare regional policy risk before procurement because the IEA cut its 2025-2030 US renewables forecast by almost 50% after tax and permitting changes.
- Use IEC 61215, IEC 61730, IEC 62116, and IEEE 1547 compliance documents to reduce technical due-diligence risk in bankable B2B tenders.
- Request FOB, CIF, and EPC turnkey pricing separately because logistics, grid studies, civil works, and local interconnection can change delivered cost by 15-45%.
- Model 25-30 year output with 0.4-0.6% annual module degradation and local irradiance data before signing PPAs or equipment supply contracts.
2026 Global Solar PV Installation Baseline
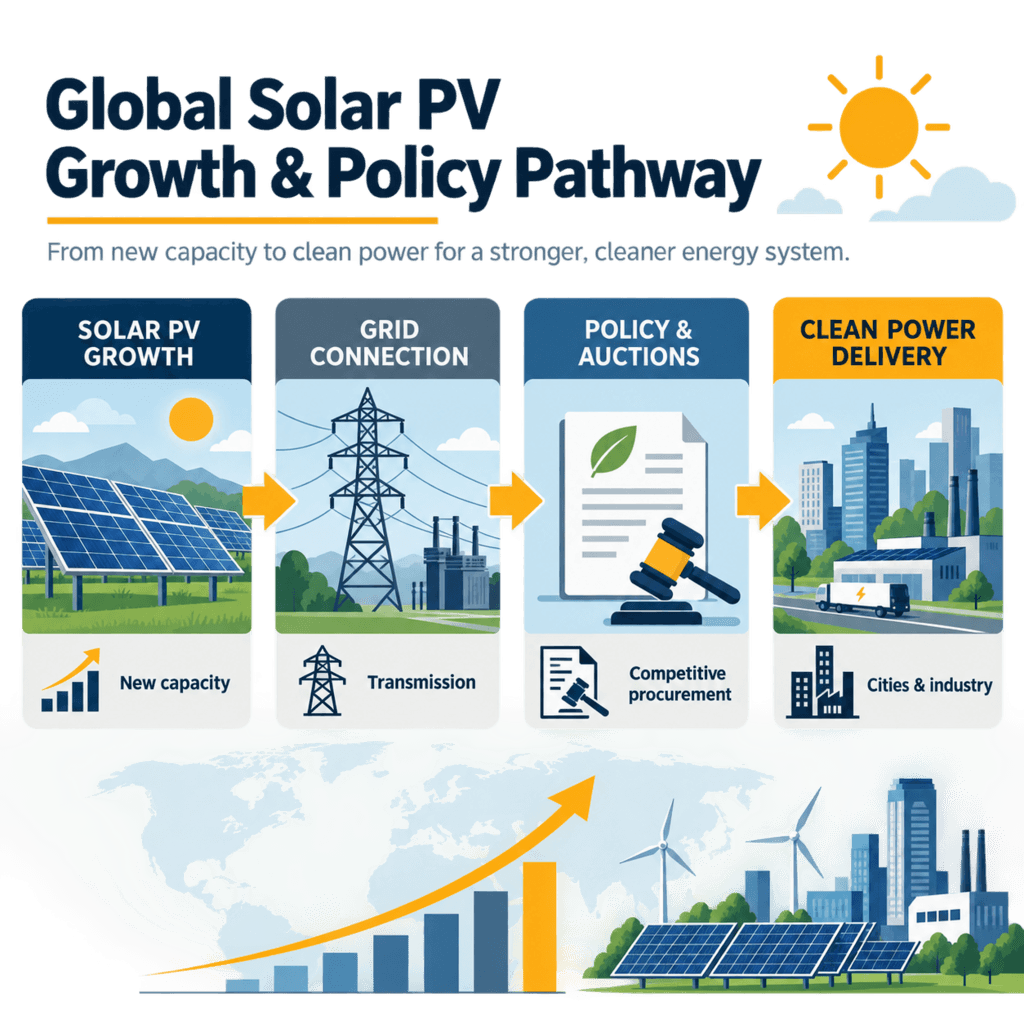
Global solar PV entered 2026 after record 2025 additions of 510.3 GW by IRENA and more than 600 GW by IEA estimates, creating a 2.8 TW installed base.
For B2B buyers, the important conclusion is not simply that solar is growing; it is that solar has become the default capacity choice in many tenders. According to IRENA (2026), solar photovoltaics accounted for 510.3 GW of the 511.2 GW of total solar power additions in 2025, while total renewable additions reached 692 GW. According to IEA (2026), solar PV surpassed 600 GW of annual additions for the first time and cumulative solar PV capacity reached around 2,800 GW.
The difference between IRENA and IEA figures reflects methodology and timing. IRENA generally reports connected year-end capacity from country statistics, while the IEA Global Energy Review includes actual and estimated additions where final data are not yet available. Procurement teams should therefore treat 510 GW as the conservative statistical baseline and 600 GW as the market-activity ceiling for 2025 installations.
According to IRENA (2026), renewables reached 5,149 GW of total installed capacity in 2025 after a 15.5% annual increase. Solar supplied roughly 75% of renewable additions, and solar plus wind represented 96.8% of net renewable growth. The practical signal is clear: module availability, EPC competition, and inverter supply are now shaped by terawatt-scale annual manufacturing, not niche clean-energy programs.
BloombergNEF (2026) states that global energy transition investment reached USD 2.3 trillion in 2025, up 8% from 2024, with renewable energy receiving USD 690 billion and grids receiving USD 483 billion. Albert Cheung of BloombergNEF states, "the global energy transition is resilient," a useful summary for buyers assessing whether policy noise has stopped deployment momentum.
| Indicator | 2024 | 2025 | 2026 Procurement Meaning |
|---|---|---|---|
| Solar PV annual additions, IRENA | 451.9 GW | 510.3 GW | Use 510 GW as confirmed 2025 statistical baseline |
| Solar PV annual additions, IEA | About 535 GW implied | More than 600 GW | Use for market momentum and near-term supply planning |
| Total renewable additions, IRENA | 585 GW | 692 GW | Renewables still dominate new power capacity |
| Total renewable additions, IEA | About 690 GW implied | 800 GW | Solar is more than three-quarters of IEA renewable additions |
| Cumulative solar PV capacity, IEA | About 2.2-2.5 TW | About 2.8 TW | PV is now the largest installed power technology by capacity |
Regional Growth Rates and Policy Impact
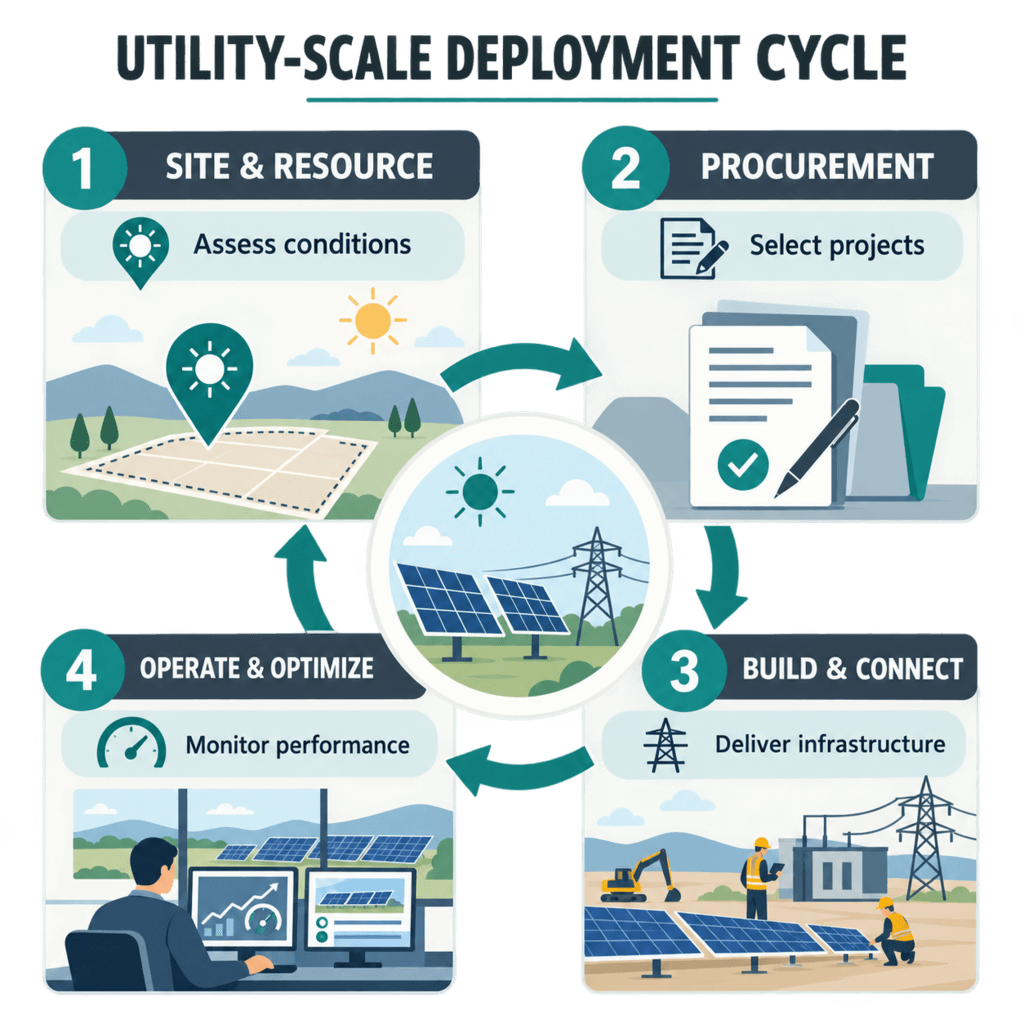
Asia led 2025 renewable additions with 513.3 GW and 74.2% global share, while Europe added nearly 70 GW of solar PV and India added almost 50 GW.
Asia-Pacific remains the center of solar PV installation statistics in 2026. According to IRENA (2026), Asia contributed 74.2% of all new renewable capacity in 2025 and added 513.3 GW of renewable capacity, a 21.6% annual growth rate. China alone commissioned nearly 370 GW of solar PV according to IEA (2026), driven partly by a rush before the June 2025 shift from fixed tariffs to competitive auctions.
Europe is smaller than Asia but still policy-critical. According to IEA (2026), the European Union installed almost 70 GW of solar PV in 2025 as part of nearly 85 GW of renewable additions. Germany added 17 GW, about one-quarter of EU solar additions, while Spain added 14 GW, up 50% from 2024. Corporate PPAs, contracts for difference, and streamlined permitting are now central to bankability.
North America shows the clearest policy split. SEIA and Wood Mackenzie reported 43.2 GWdc of US solar installations in 2025, down 14% from 2024, while solar still represented 54% of new US generating capacity. IEA (2025) later revised its 2025-2030 US renewable forecast down by almost 50%, citing faster tax-credit phaseout, FEOC restrictions, and federal permitting constraints.
Middle East and Africa are moving from pilot scale to procurement scale. According to IEA (2026), renewable capacity additions doubled in both sub-Saharan Africa and MENA to around 12 GW each in 2025. Saudi Arabia installed nearly 7 GW of solar PV after additions quadrupled, while South Africa installed more than 3 GW of solar PV for the first time.
Latin America remains strong for distributed solar but exposed to grid constraints. According to IEA (2025), higher retail electricity prices support distributed PV buildout in Latin America, while curtailment risks in Brazil and Chile have reduced some utility-scale forecasts. For commercial buyers, the lesson is to evaluate grid node capacity, export limits, and battery economics before assuming merchant revenue.
| Region | 2025 Solar/Renewables Data | Main Policy Driver | B2B Procurement Implication |
|---|---|---|---|
| Asia-Pacific | 513.3 GW renewable additions in Asia; China nearly 370 GW solar PV | China auctions and wholesale market exposure | Secure module supply early; expect price competition and grid queue risk |
| Europe | EU almost 70 GW solar PV; Germany 17 GW; Spain 14 GW | CfDs, corporate PPAs, permitting reform | Strong bankability, but lower residential incentives shift focus to C&I |
| North America | US 43.2 GWdc solar in 2025; 14% YoY decline | Tax credit timing, FEOC, interconnection queues | Use safe-harbor documentation and domestic-content review |
| Middle East/Africa | MENA and sub-Saharan Africa around 12 GW renewable additions each | Auctions, energy security, diesel displacement | Combine EPC solar with storage and grid-stabilization studies |
| Latin America | Distributed PV supported by high retail tariffs | Net billing, bilateral contracts, curtailment controls | Prioritize self-consumption and battery-ready inverter design |
Year-Over-Year Trends and 2030-2040 Outlook
Solar PV grew from roughly 138 GW annual additions in 2020 to 510-600 GW in 2025, and IEA projects PV will drive nearly 80% of renewable expansion to 2030.
The five-year trend is unusually steep. IRENA data show solar capacity additions rose from 451.9 GW in 2024 to 510.3 GW in 2025, while the IEA estimates that solar passed 600 GW in 2025 after about 12% annual growth. Fraunhofer ISE (2026) reports a global PV market CAGR of approximately 27%, dominated by crystalline silicon and N-type TOPCon.
The 2025-2030 outlook remains strong but more policy-sensitive than the 2021-2024 boom. The IEA states, "Renewable electricity additions for 2025-2030 total 4 600 GW," and solar PV represents nearly 80% of that expansion. Distributed solar accounts for 42% of overall PV expansion, which matters for commercial rooftops, farms, warehouses, telecom sites, and industrial parks.
However, growth is no longer limited mainly by module cost. According to IEA (2025), the global renewable forecast for 2025-2030 was revised down by 5%, or 248 GW, because of policy, regulatory, and market changes since October 2024. Solar PV accounts for more than 70% of that absolute reduction, mainly in utility-scale projects.
From 2030 to 2040, the key evolution will be higher efficiency and deeper system integration. Fraunhofer ISE (2026) reports that commercial silicon module efficiency improved from about 17% to just under 25% over ten years, while laboratory perovskite-silicon tandem cells promise up to 35% efficiency. Wood Mackenzie (2026) expects TOPCon to remain dominant through at least 2028, but tandem commercialization depends on heat and moisture stability.
| Period | Installation Trend | Technology Trend | Policy/Market Signal |
|---|---|---|---|
| 2020-2023 | Rapid scaling after module cost declines | PERC to TOPCon transition begins | Feed-in tariffs and early auctions coexist |
| 2024 | IRENA solar additions reached 451.9 GW | N-type modules gain share | Renewables supplied 92.5% of global capacity expansion |
| 2025-2026 | IRENA 510.3 GW solar PV; IEA more than 600 GW | TOPCon/HJT modules commonly reach 22-25% | Auctions and merchant PPAs shape bankability |
| 2027-2030 | IEA projects 4,600 GW renewable additions | Storage pairing and grid-forming inverters expand | Solar represents nearly 80% of renewable capacity growth |
| 2030-2040 | Terawatt-per-year solar becomes plausible in high-policy scenarios | Tandem modules may exceed 28-30% commercial efficiency | Grid flexibility, recycling, and local manufacturing become decisive |
Technology, Cost, and EPC Selection Benchmarks
Commercial PV procurement in 2026 should compare 22-25% module efficiency, 25-30 year warranties, USD 0.03-0.06/kWh solar LCOE, and grid-compliant inverter certification.
Technical selection is now less about whether solar works and more about whether the installed system matches the buyer's load, tariff, and grid constraints. For SOLARTODO C&I projects, typical system blocks include 50 kW greenhouse rooftops, 100 kW commercial rooftops, 500 kW industrial systems, and solar-plus-storage packages using LFP batteries. A 100 kW + 200 kWh commercial system can generate about 140-160 MWh/year in strong solar regions, while LFP storage with 6,000+ cycles supports peak shaving and backup operation.
According to Fraunhofer ISE (2026), commercial silicon modules have improved from about 17% to just under 25% efficiency over the past decade, and typical global LCOE for large PV plants is around 4 euro cents/kWh. According to NREL PVWatts methodology, site-specific energy yield depends on irradiance, tilt, azimuth, temperature, shading, and losses; procurement teams should require a bankable yield report rather than relying on nameplate capacity alone.
SOLARTODO typically recommends N-type TOPCon or HJT modules for space-constrained commercial projects, bifacial modules where albedo or roof reflectance supports rear-side gain, and string inverters for 50-500 kW systems requiring modular O&M. For weak grids, telecom towers, agriculture monitoring, and security systems, solar-plus-storage should be sized against critical loads, not only average daily consumption.
| Product Architecture | Typical Efficiency / Spec | Best Fit | Risk to Check |
|---|---|---|---|
| Monofacial PERC PV | 20-22% module efficiency | Cost-sensitive open-area projects | Lower future bankability versus N-type supply |
| N-type TOPCon bifacial PV | 22-25% module efficiency | C&I rooftops, carports, agrivoltaics | Moisture and UV reliability evidence by supplier |
| HJT bifacial PV | 22-24.5% module efficiency | Hot climates and premium projects | Higher module price and supplier availability |
| PV + LFP battery | 95% round-trip efficiency; 6,000+ cycles | Peak shaving, backup, weak grids | Fire code, EMS controls, and warranty terms |
| Grid-tied string inverter | 98%+ peak efficiency | 50-500 kW distributed PV | Anti-islanding and local grid-code compliance |
EPC Investment Analysis and Pricing Structure
A bankable EPC solar package separates FOB supply, CIF delivery, and turnkey construction, with 50+ unit volume discounts and 3-8 year payback in high-tariff markets.
EPC means Engineering, Procurement, and Construction. For a solar PV project, EPC turnkey delivery usually includes site survey, structural review, electrical design, bill of materials, module and inverter procurement, mounting system, DC and AC protection, installation supervision, commissioning, monitoring setup, as-built documentation, and handover training. Grid application, civil works, customs clearance, and local permits may be included or priced separately depending on the country.
SOLARTODO is a B2B manufacturer and exporter, not an online marketplace. The normal workflow is inquiry, technical sizing, offline quotation, commercial negotiation, production, shipment, installation support, and after-sales service. Buyers can request FOB Supply for factory-gate equipment, CIF Delivered for equipment landed at destination port, or EPC Turnkey for project-level delivery with construction and commissioning scope.
Three-tier pricing prevents hidden assumptions. FOB Supply is usually best for distributors and EPC contractors with local installation teams. CIF Delivered is useful when buyers want SOLARTODO to manage ocean freight and insurance. EPC Turnkey is appropriate for commercial owners, agriculture groups, telecom operators, and infrastructure developers that need one accountable delivery package.
Indicative volume guidance can be applied to repeat equipment orders: 50+ units or equivalent project blocks may qualify for a 5% discount, 100+ for 10%, and 250+ for 15%, subject to module wattage, inverter brand, battery capacity, incoterms, and shipping schedule. Standard payment terms are 30% T/T deposit plus 70% against bill of lading, or 100% L/C at sight. Project financing is available for large projects above USD 1,000K after credit and project review. Contact: [email protected].
| Commercial Model | What It Includes | Typical Buyer | Cost/ROI Impact |
|---|---|---|---|
| FOB Supply | Modules, inverters, mounting, cables, protection devices | Distributor or local EPC | Lowest equipment price; buyer manages freight and installation |
| CIF Delivered | FOB package plus ocean freight and insurance | Importer or regional contractor | Reduces logistics risk; landed cost clearer before customs |
| EPC Turnkey | Engineering, procurement, construction, commissioning | Asset owner or infrastructure developer | Higher upfront scope; lower interface risk and faster commissioning |
| Application | Typical Size | Annual Yield Benchmark | Payback Driver |
|---|---|---|---|
| Greenhouse rooftop PV | 50 kW | 72-85 MWh/year | Irrigation, fans, fertigation loads at USD 0.10-0.18/kWh |
| C&I rooftop PV | 100-500 kW | 140-850 MWh/year | Self-consumption and demand-charge reduction |
| Solar + LFP storage | 100 kW + 200 kWh | 140-160 MWh/year plus peak shifting | Peak shaving, backup, time-of-use arbitrage |
| Telecom or security site | 5-50 kW | Site-specific | Diesel displacement and outage resilience |
FAQ
Solar PV buyers in 2026 most often ask about 510-600 GW installation statistics, policy risk, EPC pricing, warranties, and storage readiness.
Q: What were global solar PV installations in 2025 and why do 2026 reports differ? A: IRENA reported 510.3 GW of solar PV additions in 2025, while IEA estimated that solar surpassed 600 GW. The difference comes from methodology: IRENA uses connected year-end statistical reporting, while IEA includes actual and estimated additions where final data are incomplete. Buyers should use both figures as a conservative-to-high market range.
Q: Which region installed the most solar PV capacity? A: Asia-Pacific dominated 2025 deployment, led by China. IRENA reported Asia contributed 513.3 GW of renewable additions, equal to 74.2% of the global total. IEA estimated China alone commissioned nearly 370 GW of solar PV in 2025, far ahead of Europe, India, the United States, Latin America, and Africa.
Q: How did policy changes affect solar PV growth in 2026 planning? A: Policy became a bigger installation constraint than module supply. IEA revised its 2025-2030 renewable forecast down by 5%, or 248 GW, after changes in tax credits, auctions, permitting, and market rules. The United States saw the sharpest impact, with its renewable forecast reduced by almost 50%.
Q: Why are competitive auctions important for utility-scale solar PV? A: Competitive auctions are becoming the main procurement pathway for utility-scale renewables. IEA projects auctions will account for almost 60% of gross utility-scale renewable additions from 2025-2030, up from less than 25% in the previous forecast. Auctions can lower prices but also compress margins and increase bid discipline.
Q: What module technology should commercial buyers specify in 2026? A: Most commercial buyers should specify N-type TOPCon or HJT modules with about 22-25% efficiency. Fraunhofer ISE reports commercial silicon module efficiency rose from about 17% to just under 25% over ten years. Bifacial modules are especially useful for reflective rooftops, carports, agrivoltaics, and ground-mount arrays.
Q: How long is the typical payback period for C&I solar PV? A: C&I solar payback commonly ranges from 3-8 years, depending on tariff, self-consumption, financing cost, and EPC scope. A 50 kW greenhouse rooftop system generating 72-85 MWh/year can save USD 7,200-15,300 annually at USD 0.10-0.18/kWh electricity prices before escalation and incentives.
Q: What does EPC turnkey delivery include for SOLARTODO projects? A: EPC turnkey delivery includes engineering, procurement, construction support, commissioning, monitoring setup, documentation, and handover training. SOLARTODO can quote FOB Supply, CIF Delivered, or EPC Turnkey depending on buyer responsibility. Standard terms are 30% T/T plus 70% against B/L, or 100% L/C at sight.
Q: When should a solar PV project include battery storage? A: Battery storage is recommended when the site has high peak tariffs, weak grid reliability, export limits, or critical loads. A 100 kW + 200 kWh system can support peak shaving, backup power, and time-of-use shifting. LFP batteries with 6,000+ cycles and 95% round-trip efficiency are common for C&I projects.
Q: Which certifications matter for bankable solar PV procurement? A: Buyers should require IEC 61215 for module design qualification, IEC 61730 for module safety, IEC 62116 for inverter anti-islanding, and IEEE 1547 for distributed energy interconnection where applicable. UL 9540 is important for energy storage systems. Certification documents should match the exact model numbers supplied.
Q: How should buyers compare FOB, CIF, and EPC pricing? A: Compare FOB, CIF, and EPC pricing by separating equipment cost, freight, insurance, customs, civil works, installation, grid studies, and commissioning. FOB is lowest but transfers logistics risk to the buyer. CIF clarifies landed shipment cost. EPC turnkey costs more upfront but reduces interface risk and schedule uncertainty.
Conclusion
Solar PV installation decisions in 2026 should treat 510-600 GW annual deployment, 2.8 TW cumulative capacity, and auction-driven policy risk as the core planning baseline.
Bottom line: global solar PV is now a terawatt-scale infrastructure market, and B2B buyers should procure through bankable EPC structures, certified 22-25% modules, and region-specific ROI models. For commercial installations above 50 kW, SOLARTODO can provide FOB, CIF, or EPC turnkey quotations with financing review for projects above USD 1,000K.
References
- IEA Global Energy Review (2026): Reports global renewable additions of 800 GW, solar PV additions above 600 GW, and cumulative solar PV capacity around 2,800 GW. — https://www.iea.org/reports/world-energy-outlook-2024
- IEA Renewables (2025): Forecasts 4,600 GW renewable capacity additions from 2025-2030, with solar PV representing nearly 80% of global renewable electricity expansion. — https://www.iea.org/reports/world-energy-outlook-2024
- IRENA Renewable Capacity Statistics (2026): Reports 692 GW renewable capacity additions in 2025, including 510.3 GW of solar photovoltaics and 5,149 GW total renewable capacity. — https://www.irena.org/Data/View-data-by-topic/Capacity-and-Generation
- BloombergNEF Energy Transition Investment Trends (2026): Reports USD 2.3 trillion global energy transition investment in 2025, including USD 690 billion for renewable energy and USD 483 billion for grids. — https://about.bnef.com/
- Fraunhofer ISE Photovoltaics Report (2026): Provides PV market, efficiency, cost, and technology data, including commercial silicon module efficiency just under 25% and approximately 27% PV CAGR. — https://www.ise.fraunhofer.de/en.html
- Wood Mackenzie Global Solar Outlook (2026): Assesses 2026 solar demand, technology risk, TOPCon dominance through at least 2028, and policy/geopolitical impacts on global deployment. — https://www.woodmac.com/
- IEC 61215 and IEC 61730 (2021-2023): International photovoltaic module design qualification and safety qualification standards used for bankable PV procurement. — https://webstore.iec.ch/
- IEEE 1547 and IEC 62116 (2018): Grid interconnection and inverter anti-islanding standards used for distributed energy resources and grid-connected PV systems. — https://standards.ieee.org/ieee/1547/7382/ The 2026 solar PV data baseline is drawn from 8 authoritative sources covering capacity statistics, policy forecasts, technology performance, investment, and interconnection standards.
- IEA (2026): Global Energy Review 2026, solar PV and wind section, reporting more than 600 GW solar PV additions and about 2,800 GW cumulative PV capacity. https://www.iea.org/reports/global-energy-review-2026/technology-solar-pv-and-wind
- IEA (2025): Renewables 2025, forecasting 4,600 GW renewable additions from 2025-2030 and nearly 80% PV contribution to expansion. https://www.iea.org/reports/renewables-2025/renewable-electricity
- IRENA (2026): Renewable Capacity Statistics 2026, reporting 692 GW renewable additions and 510.3 GW solar PV additions in 2025. https://www.irena.org/Publications/2026/Mar/Renewable-capacity-statistics-2026
- BloombergNEF (2026): Energy Transition Investment Trends 2026, reporting USD 2.3 trillion global transition investment and USD 690 billion renewable energy investment in 2025. https://about.bnef.com/insights/clean-energy/bloombergnef-finds-global-energy-transition-investment-reached-record-2-3-trillion-in-2025-up-8-from-2024/
- Fraunhofer ISE (2026): Photovoltaics Report, summarizing PV market CAGR, commercial module efficiency improvements, and global PV LCOE benchmarks. https://www.ise.fraunhofer.de/en/publications/studies/photovoltaics-report.html
- Wood Mackenzie (2026): Global Solar 2026 Outlook, identifying TOPCon dominance through at least 2028 and policy-driven market recalibration. https://www.woodmac.com/news/opinion/solar-2026-outlook-half-time/
- IEC 61215 and IEC 61730 (2021-2023): Photovoltaic module design qualification and safety qualification standards for crystalline silicon modules.
- IEEE 1547-2018 and IEC 62116 (2018): Distributed energy interconnection and inverter anti-islanding standards for grid-connected PV systems.
About SOLARTODO
SOLARTODO is a global integrated solution provider specializing in solar power generation systems, energy-storage products, smart street-lighting and solar street-lighting, intelligent security & IoT linkage systems, power transmission towers, telecom communication towers, and smart-agriculture solutions for worldwide B2B customers.
Procurement paths
About the Author

Cinn Song
Founder & Chief Solutions Architect
Cinn Song founded SOLARTODO LIMITED and leads its smart-city infrastructure engineering — from solar, storage and integrated smart poles to the company's push into physical-AI city edge nodes: pole-mounted edge computing, vertical LLMs for smart cities, drone-based O&M with autonomous battery swapping, robotic maintenance, and high-speed counter-UAS interception. Since 2010, he has directed turnkey EPC + BOT delivery across 50+ countries, including telecom monopole supply for national grid operators, off-grid solar street-lighting for African municipalities, and integrated smart-pole programs for Gulf smart cities.
Cite This Article
Cinn Song. (2026). Global Solar PV Installation Statistics 2026: Growth Rates…. SOLARTODO. Retrieved from https://solartodo.com/knowledge/global-solar-pv-installation-statistics-2026-growth-rates-policy-impact
@article{solartodo_global_solar_pv_installation_statistics_2026_growth_rates_policy_impact,
  title = {Global Solar PV Installation Statistics 2026: Growth Rates…},
  author = {Cinn Song},
  journal = {SOLARTODO Knowledge Base},
  year = {2026},
  url = {https://solartodo.com/knowledge/global-solar-pv-installation-statistics-2026-growth-rates-policy-impact},
  note = {Accessed: 2026-10-14}
}
Published: August 19, 2026 | Available at: https://solartodo.com/knowledge/global-solar-pv-installation-statistics-2026-growth-rates-policy-impact
Subscribe to Our Newsletter
Get the latest solar energy news and insights delivered to your inbox.
View All Articles